Edible
Requires preparation

Set your location to see data for your region.
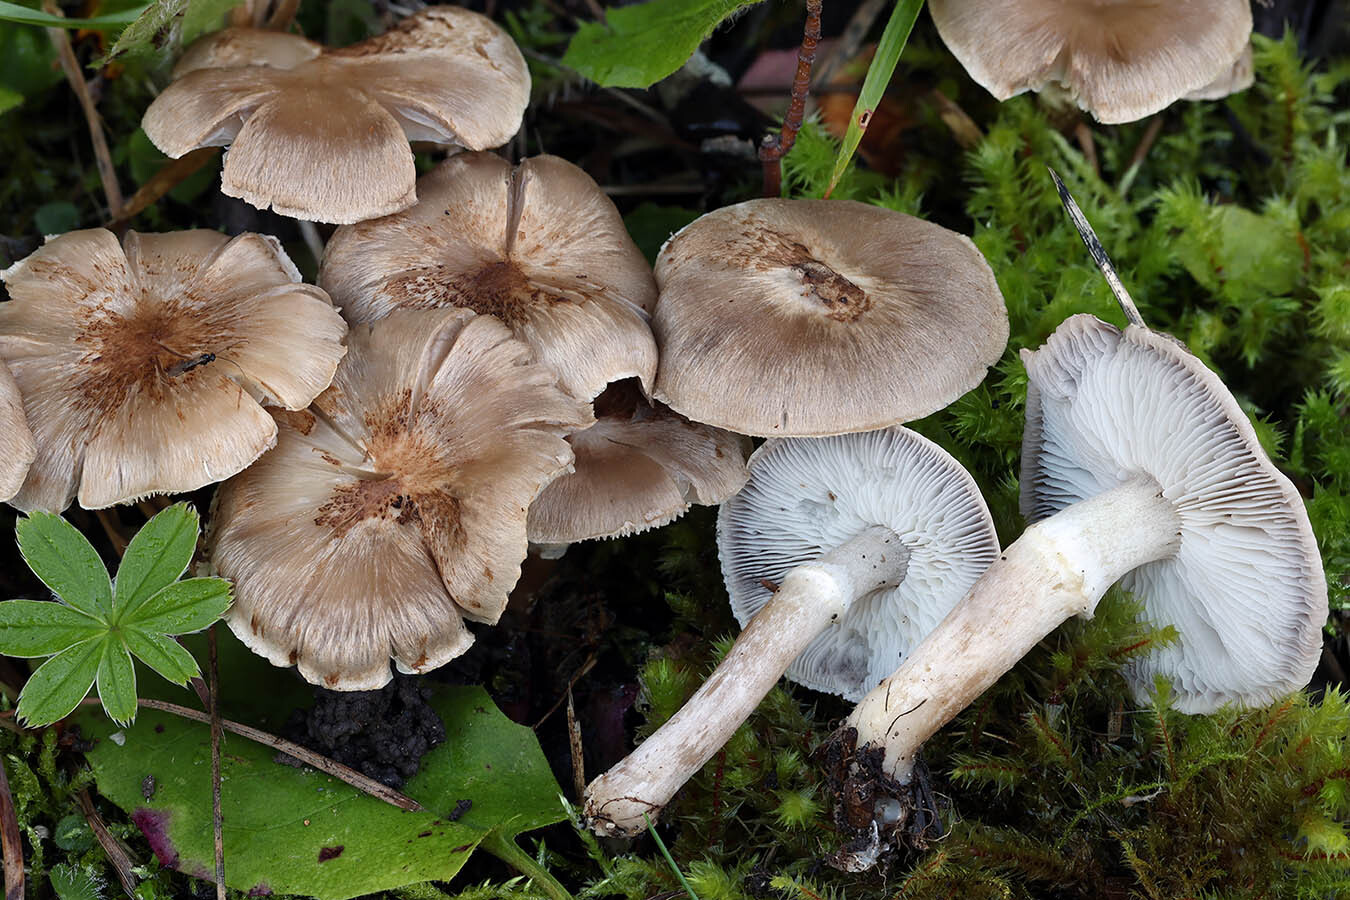
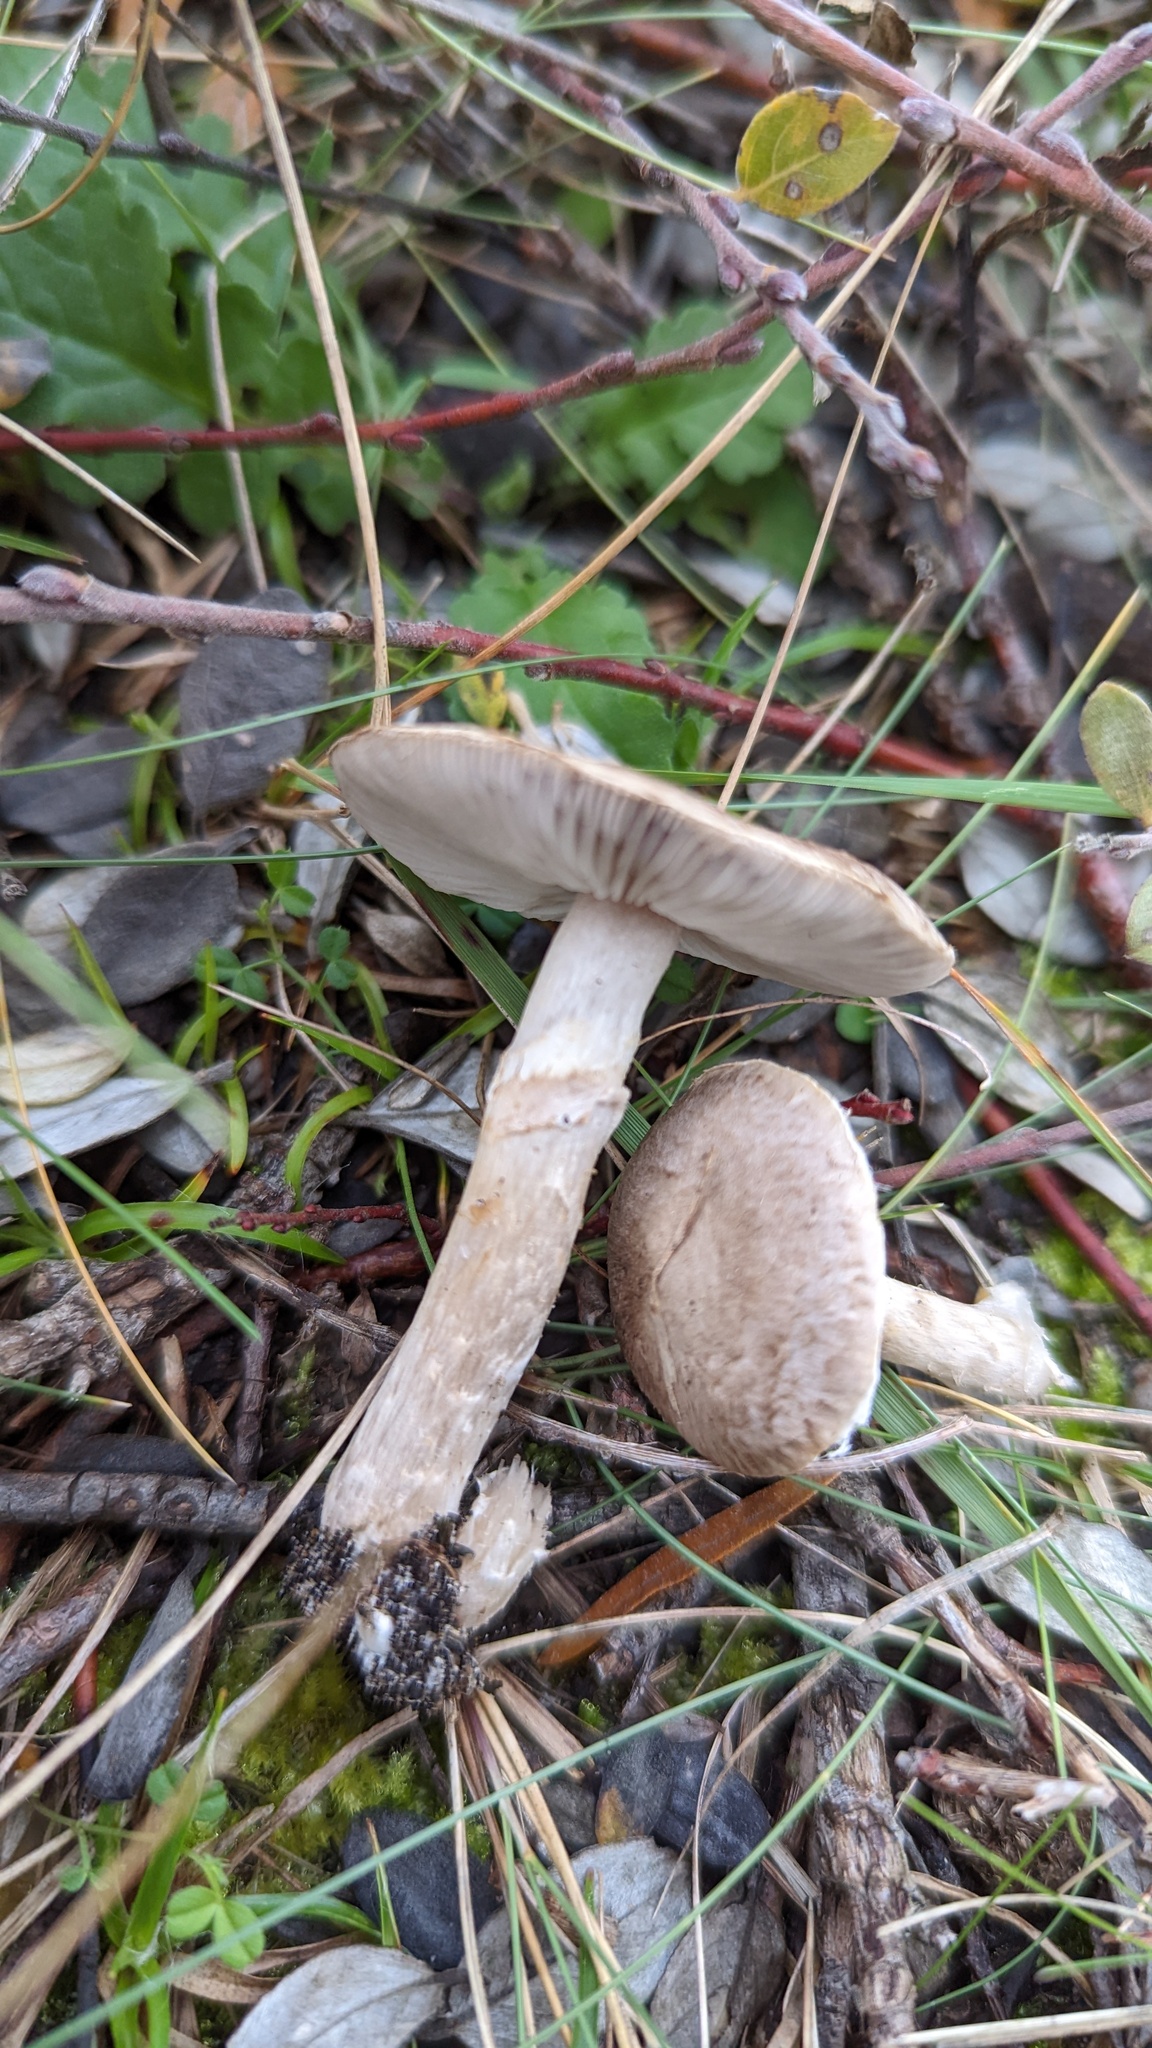
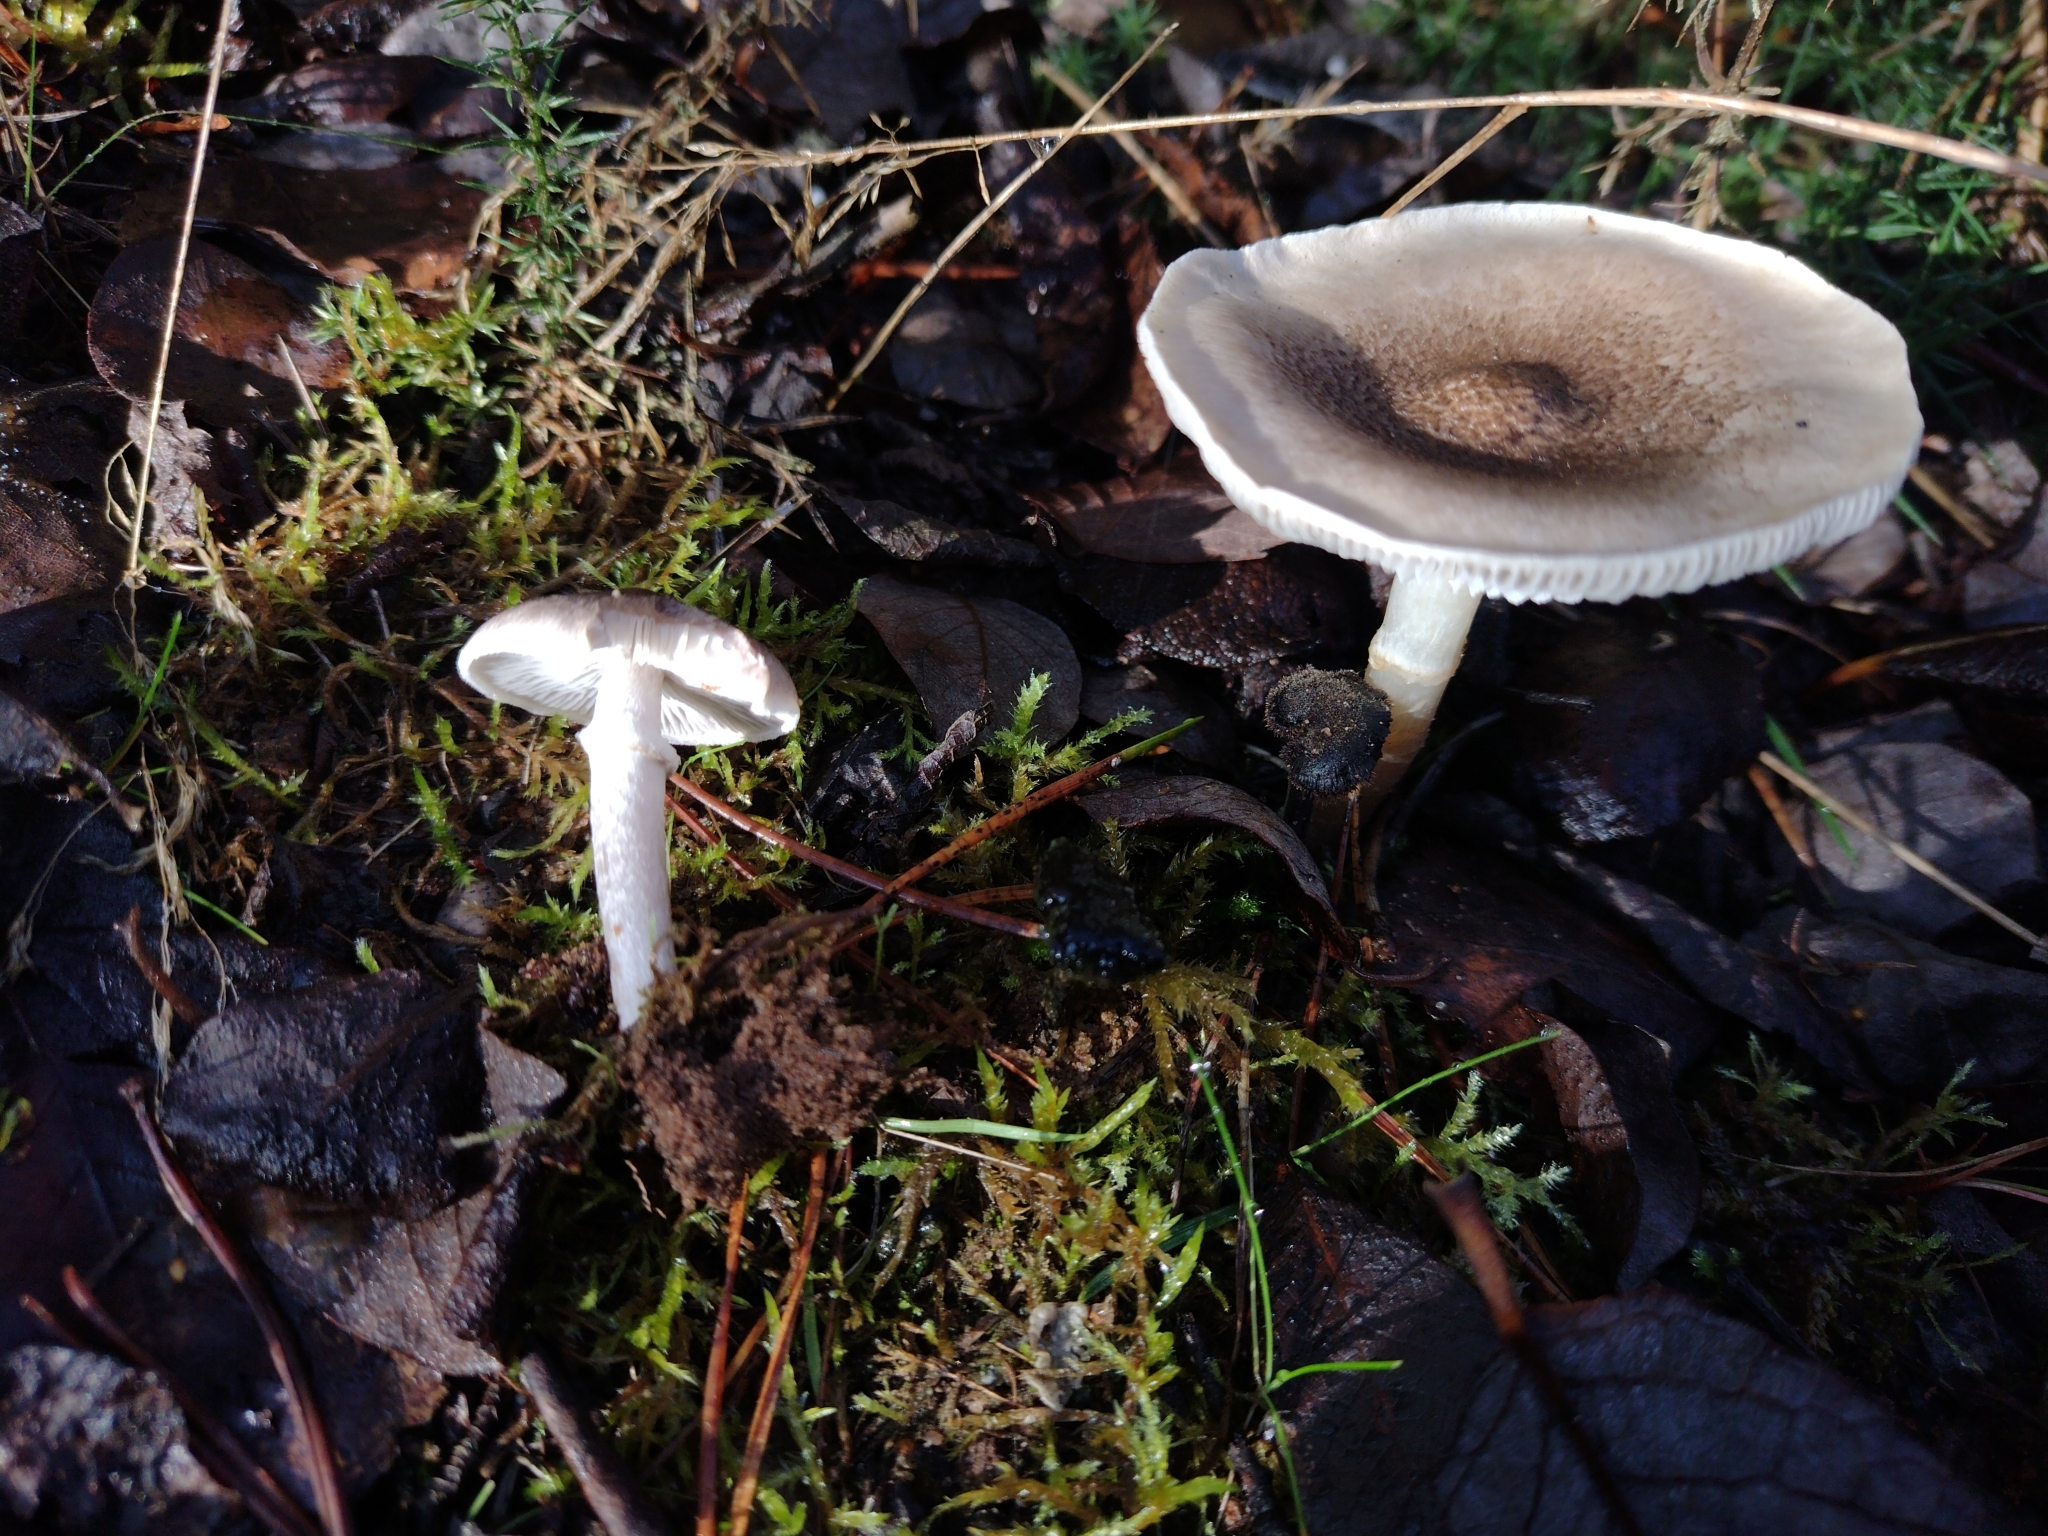
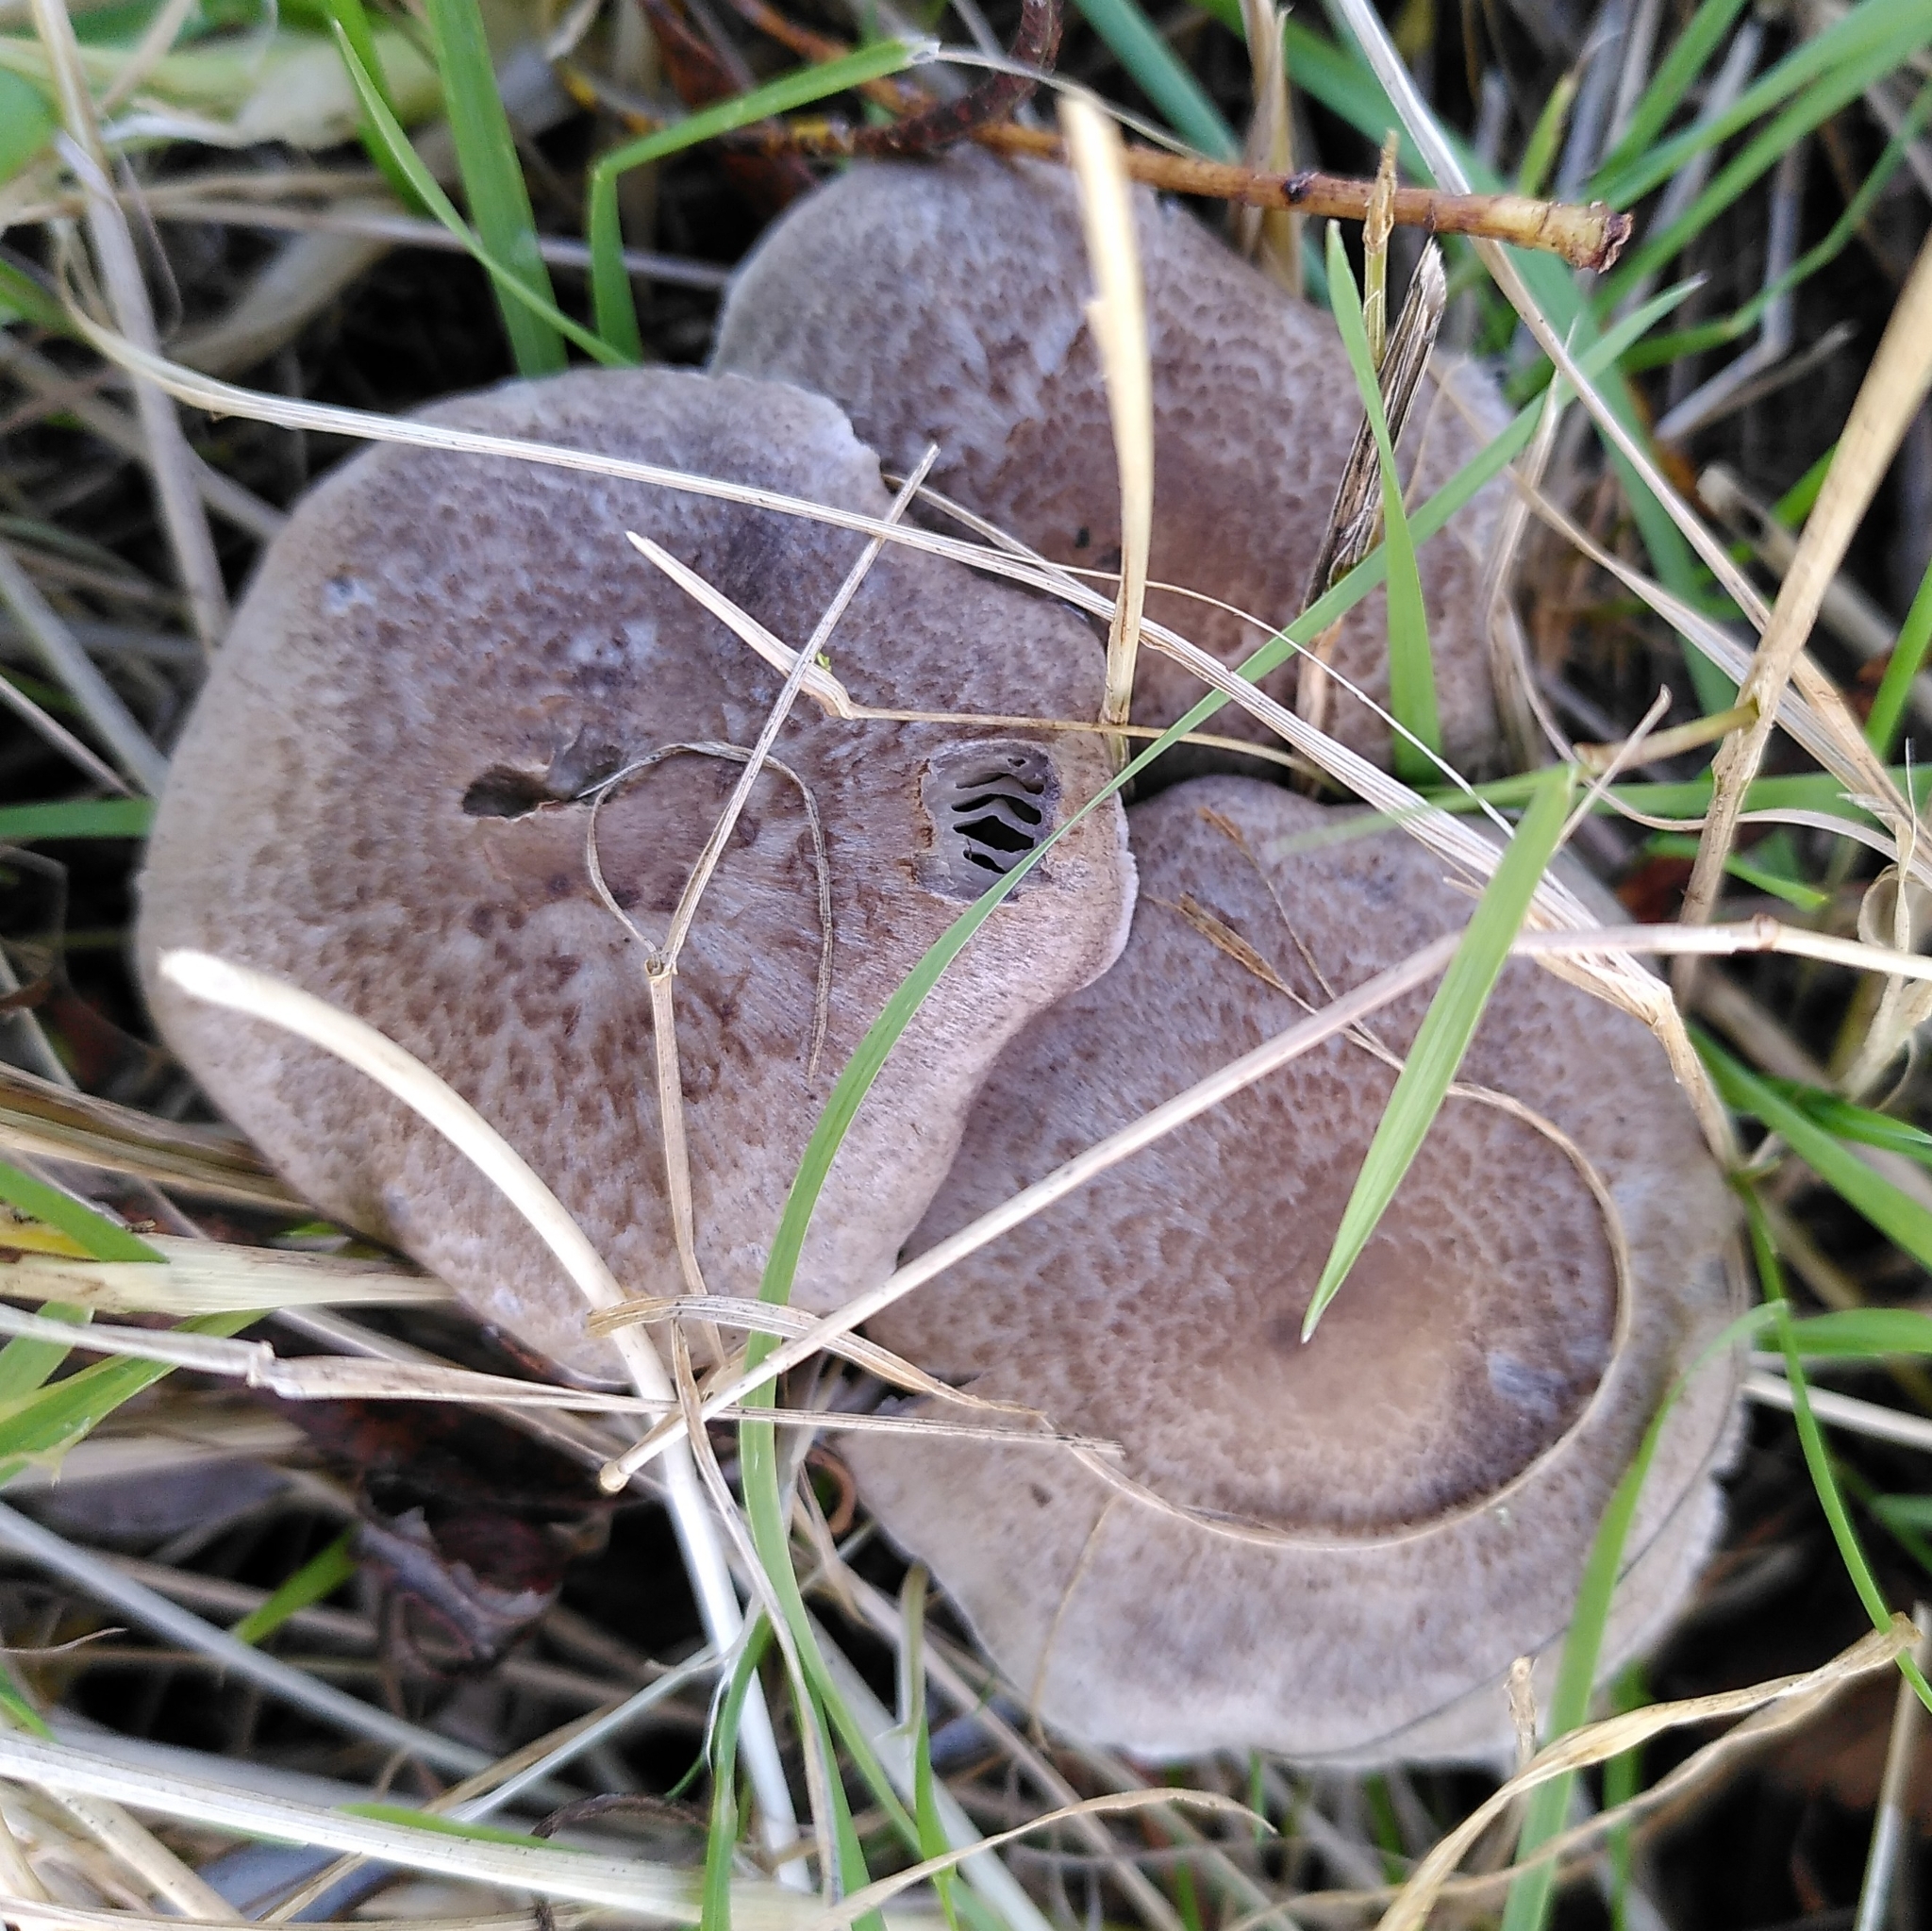
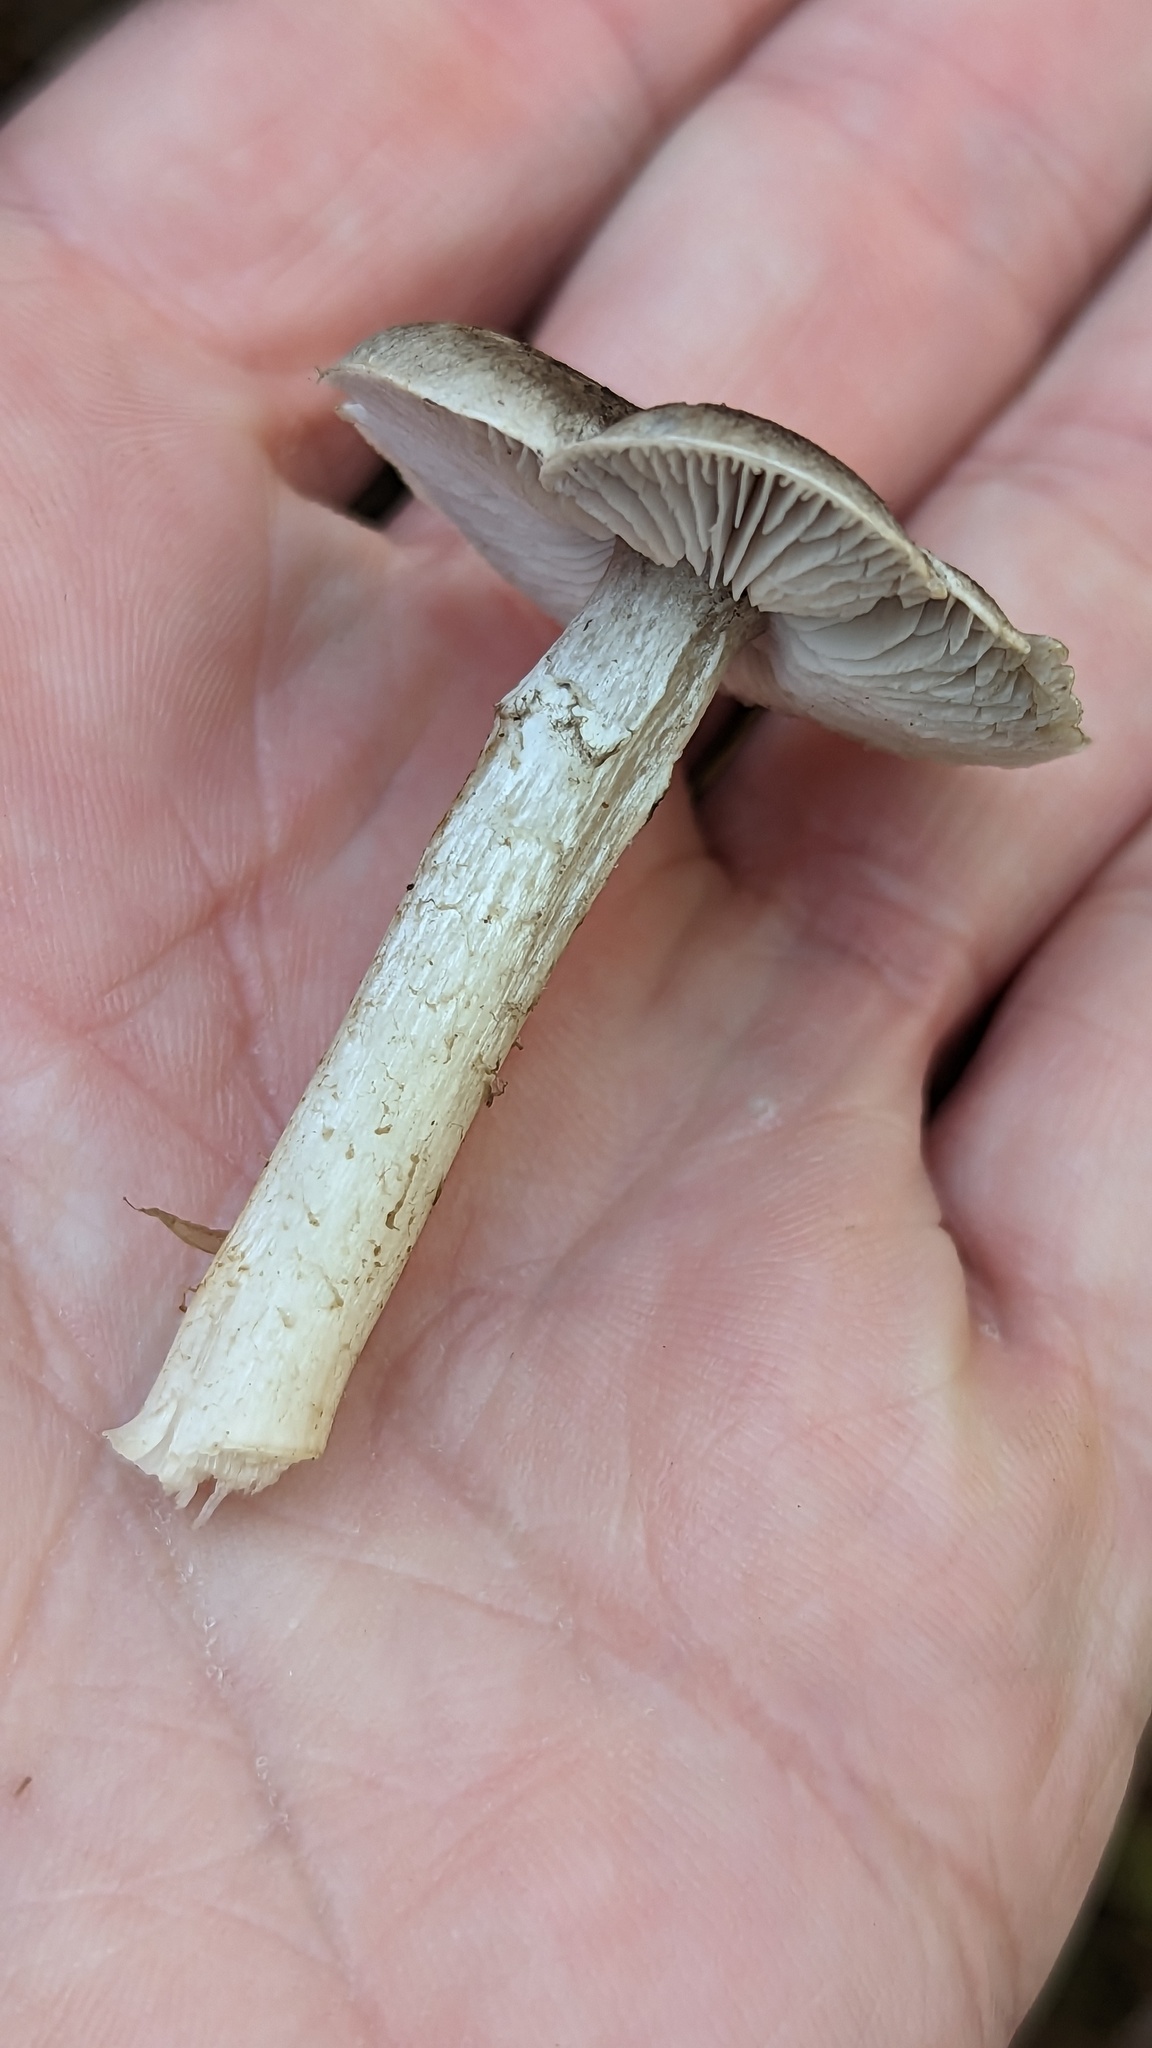
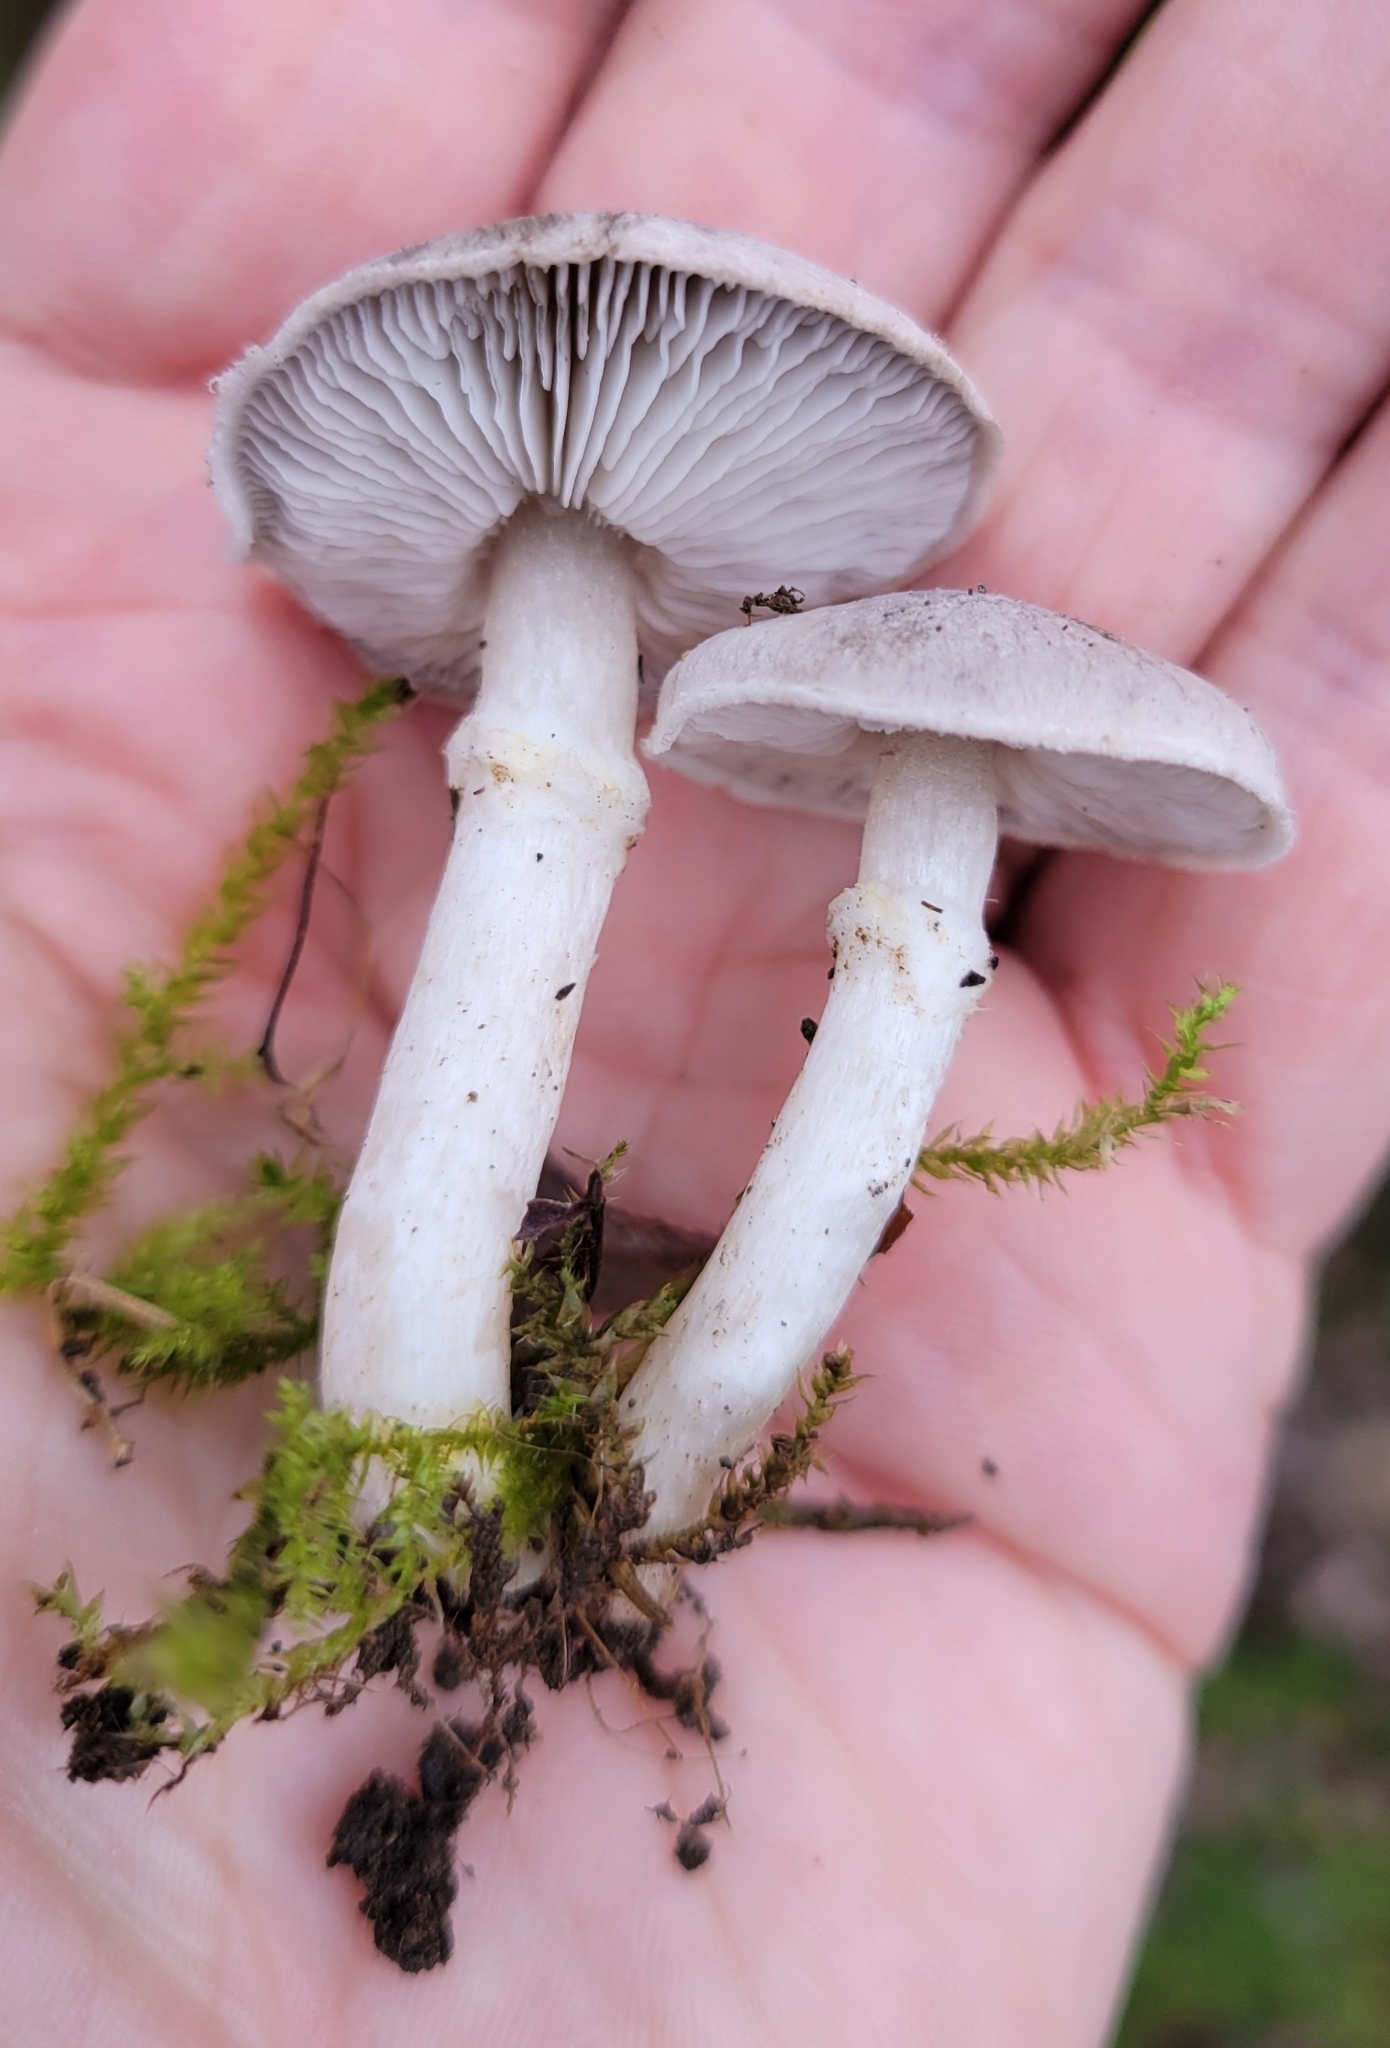
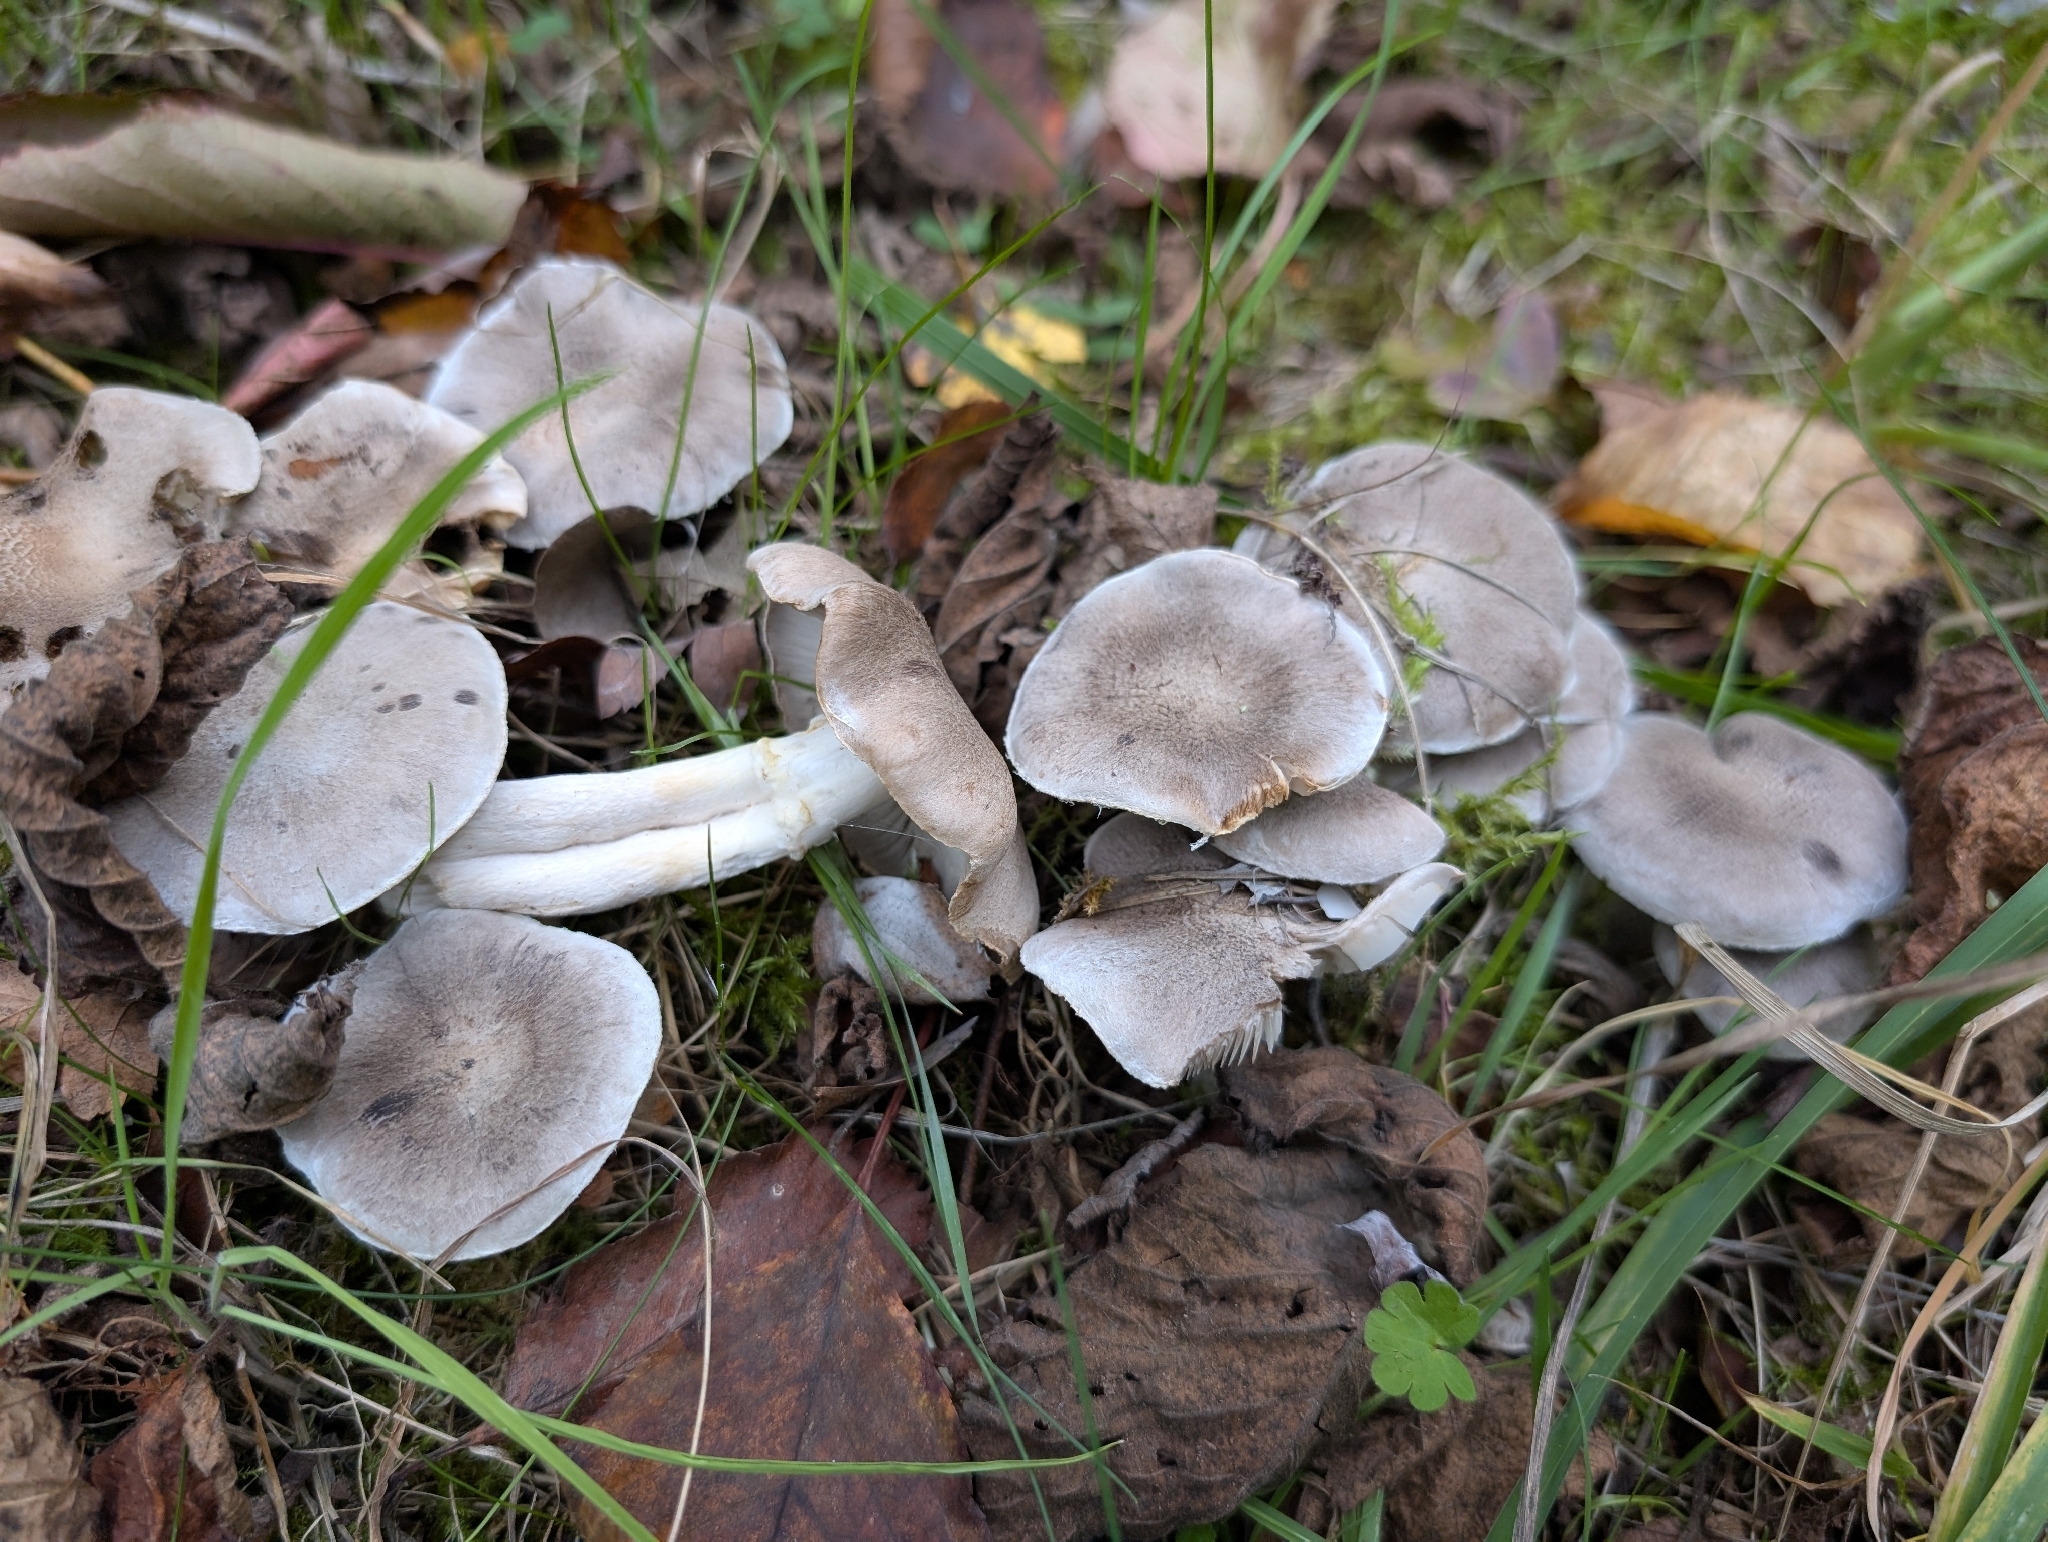


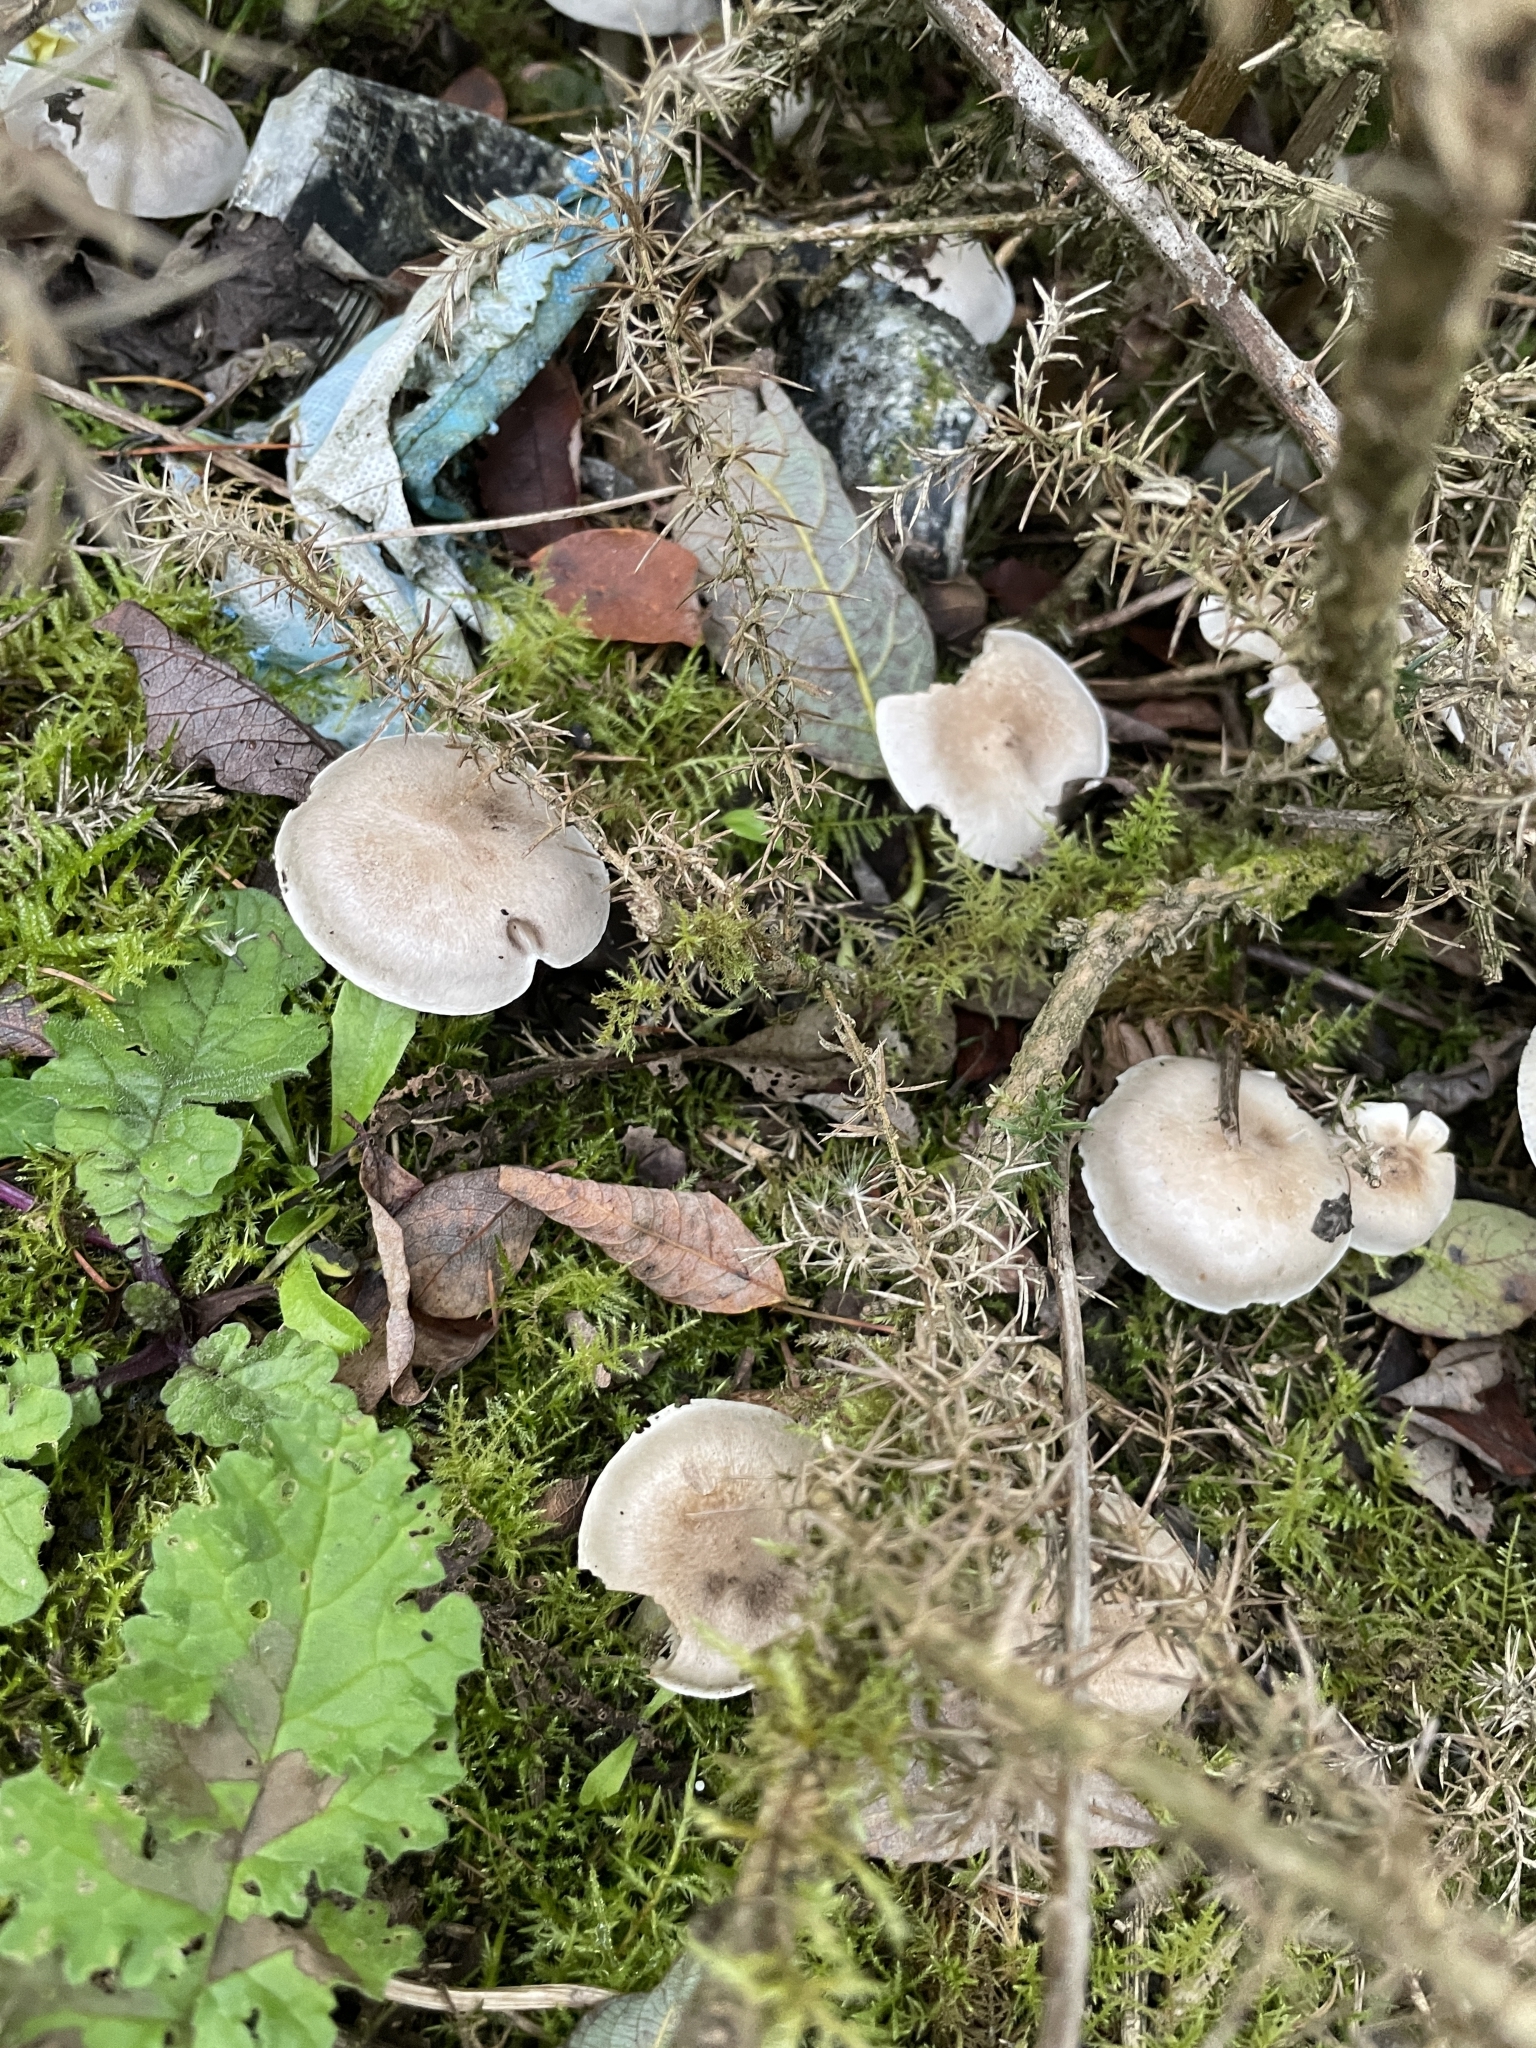
Tricholoma cingulatum, commonly known as the girdled knight or girdled tricholoma, is a distinctive agaric characterized by a pale greyish to grey-brown fibrillose cap, pale gills, and a conspicuous membranous ring on the upper stipe. It forms strict ectomycorrhizal associations with willows (Salix) in moist, damp habitats. Fruiting from late summer to late autumn, it is notable among knights for its woolly annulus and prominent sweet, farinaceous odor.
Identification, habitat, and key differences.
Forager
Fruitbody structure
- Fruit body form
- Fruit body form: Cap, stipe.
Cap
- Cap shape
- Cap shape: hemispherical or bell-shaped.
Cap shape: flat.
Cap shape: convex.
Cap shape: convex (flattened profile). - Cap surface
- Cap surface: dry.
- Cap covering
- Cap covering: felty.
Cap covering: scaly (fine scales).
Cap covering: scaly (fine scales, greyish-brown covering).
Cap covering: scaly (fine scales, olive).
Cap covering: scaly (brown).
Cap covering: scaly (greyish-brown covering). - Cap surface sheen
- Cap surface sheen: matt.
- Cap colour
- Cap colour: grayish.
Cap colour: white.
Cap colour: gray (light shade).
Cap colour: grey-brown. - Margin orientation
- Margin orientation: inrolled.
in young fruit bodies: Margin orientation: curved inward. - Cap margin outline
- Cap margin outline: wavy.
- Cap diameter
- The cap measures 30–60 mm in diameter.
- Cap centre
- Cap centre: with a distinct umbo (blunt umbo, sometimes).
Cap centre: with a distinct umbo. - Partial veil
- in young fruit bodies: Partial veil: present (from the cap margin to the stipe, whitish, cobwebby).
Underside of the cap
- Hymenophore type
- Hymenophore type: gills.
Gills at stipe
- Hymenophore attachment to the stipe
- Hymenophore attachment to the stipe: attached to the stipe (gills).
Hymenophore attachment to the stipe: free from the stipe (gills). - Hymenophore profile at the stipe
- Hymenophore profile at the stipe: notched at the stipe (gills).
- Decurrence of the hymenophore on the stem
- Decurrence of the hymenophore on the stem: decurrent with a tooth (gills).
- Natural color of the gill surface
- Natural color of the gill surface: whitish.
Natural color of the gill surface: grey.
in mature fruit bodies: Natural color of the gill surface: yellowish.
Natural color of the gill surface: whitish.
Natural color of the gill surface: cream. - Gill spacing
- Gill spacing: moderately crowded.
Gill spacing: closely spaced. - Gill depth
- Gill depth: 2–4 mm.
- Presence of short gills
- Presence of short gills: present.
- Number of series of lamellulae lengths
- Number of series of lamellulae lengths: 2–3.
Stem and base
- Stipe shape
- Stipe shape: cylindrical.
- Stipe colour
- Stipe colour: whitish or grey-brown.
Stipe colour: white or whitish.
Stipe colour: white. - Stipe surface covering
- Stipe surface covering: Felted and fibrillose.
in the upper part of the stipe: Stipe surface covering: floccose or scaly. - Stipe interior
- Stipe interior: solid.
- Stipe length
- Stipe length: 30–80 mm.
- Stipe diameter
- Stipe diameter: 5–15 mm.
Ring
- Ring presence
- Ring presence: present.
Ring presence: present.
Ring presence: present. - Structure of the ring material
- Structure of the ring material: cottony.
Structure of the ring material: cottony.
Structure of the ring material: cottony. - Ring position
- Ring position: in the upper part of the stem.
Ring position: in the upper part of the stem. - Ring colour
- Ring colour: whitish.
Ring colour: white.
Flesh
- Flesh colour
- Flesh colour: whitish.
Flesh colour: white or cream. - Flesh firmness
- Flesh firmness: firm.
- Flesh structure
- Flesh structure: fibrous (stipe flesh).
- Flesh odour
- Flesh odour: mealy (whole fruit body).
Flesh odour: pleasant (flesh). - Cap flesh thickness
- Cap flesh thickness: 2–3 mm.
- Flavor notes
- Flavor notes: mealy.
Where and when it grows
- Habitat
- Habitat: forest of unspecified type.
Habitat: coniferous woodland or mixed woodland.
Habitat: deciduous woodland, mixed woodland, alluvial forest, forest edge, shrubland, ruderal or urban habitat, meadow or orchard. - Substrate
- Substrate: soil.
- Fruit body growth pattern
- Fruit body growth pattern: in groups.
Fruit body growth pattern: solitary or scattered groups.
Fruit body growth pattern: in groups, scattered groups or in rings. - Occurrence frequency
- Fruiting season
- Fruit bodies appear from October to December (observed period, observation years: 2006, 2008, 2009, 2011, 2012, 2014, 2015, 2016, 2020, 2023, observation months: 10, 11, 12).
- Distribution area
- Potwierdzono występowanie w Polsce.
Edibility and culinary use
- Edibility
- Edible
- Required preparation
- Requires preparation
Law
- Protection
- It is not on the Polish list of protected fungal species.
- Trade
- It is not on the Polish list of mushrooms approved for trade.
FAQ
What tree host does Tricholoma cingulatum strictly associate with?
It forms an obligate ectomycorrhizal partnership strictly with willow species (Salix), including weeping willow, white willow, and creeping willow.
In what types of habitats is Tricholoma cingulatum found?
It thrives in wet habitats like willow carrs, riverbanks, lake margins, fen edges, damp dune slacks, and periodically flooded lowlands.
When does the fruiting season of Tricholoma cingulatum occur?
Fruiting occurs from late summer through late autumn, typically peaking between September and November depending on autumn rainfall.
What prominent physical ring feature gives this mushroom its name?
It possesses a distinct membranous, woolly ring on its stipe; its epithet 'cingulatum' means belted or girdled in Latin.
What is the characteristic odor and taste of this species?
It has a strong farinaceous (flour-like or mealy) odor and flavor, which can turn bitter in older, overmature specimens.
Is Tricholoma cingulatum safe to consume raw?
No, it should never be consumed raw. Thorough cooking is required to eliminate heat-sensitive compounds that cause digestive discomfort.
How is Tricholoma cingulatum viewed culinarily in Western Europe?
It is largely disregarded for the table due to its strong mealy taste, soft texture, and localized occurrence in wetland areas.
Does Tricholoma cingulatum have any traditional folklore associations?
No, it has no folklore or mythological ties; historical interest has been purely scientific, focusing on taxonomy and wetland ecology.
How is this fungus applied in modern ecological restoration?
It is used as a specific mycorrhizal inoculum on willow cuttings to promote root growth in restoring degraded riparian zones and wetlands.
How do environmental agencies utilize Tricholoma cingulatum?
Conservationists use its presence as a biological indicator to evaluate the ecological stability and water quality of willow wetland sites.
Enthusiast
Names and history
- Current national name
- Gąska wierzbowa
- Current taxonomic name
- Tricholoma cingulatum
- Remaining names
- gąska obuta
Home observations
Spore print
- Required materials
- fresh, mature cap, sheet of paper, glass or small bowl, water
- Time
- 2–24 h
- Procedure
- Place the cap underside down on the paper.
- Add a drop of water on top and cover.
- After 2–24 hours, lift the cap and examine the deposit.
What to look for
- Spore print colour
- Spore print colour: white.
Under the microscope
- Required materials
- light microscope, microscope slide and cover slip, needle, water, spores from print
- Procedure
- Transfer a small amount of the spore print onto the slide using a needle.
- Add a drop of water, cover with a cover slip, and examine the spores.
What to look for
- Spore shape
- Spore shape: ellipsoid. Spore shape: cylindrical. Spore shape: ellipsoid (broad). Spore shape: ellipsoid. Spore shape: ellipsoid (elongated).
- Spore surface
- Spore surface: smooth. Spore surface: smooth.
- Spore dimensions
- Length 4–7.2 µm, width 2.5–4.2 µm.
- Spore dimensions
- Length 5.2 µm, width 3.1 µm.
Compare dimensions after calibrating the microscope scale.
Ecology and distribution
- Mycorrhizal hosts
- General species association: Mycorrhizal hosts: Salix repens (general partner list).
- Mode of nutrition
- Mode of nutrition: ectomycorrhizal.
Non-culinary uses
Tricholoma cingulatum has no documented history of traditional non-culinary applications in folk medicine, craft, dyeing, or domestic utility; however, it has acquired concrete non-culinary applications in modern environmental management and forestry science. The fungus is deployed in willow-based ecological restoration and land reclamation programs, where its mycelium is used to inoculate willow saplings (Salix species) planted in degraded riparian corridors, former mining spoil banks, and urban retention basins to accelerate plant establishment and root development. In environmental bioindication and conservation planning, the documented presence of Tricholoma cingulatum fruiting bodies is utilized by conservationists and government agencies as a biological metric to evaluate the ecological health and hydrological integrity of threatened wetland and fen habitats. Additionally, the species is maintained in culture collections and utilized in academic forestry education as a practical demonstration organism to illustrate obligate host-specific ectomycorrhizal relationships between higher fungi and riparian hardwood trees.
History and culture
Tricholoma cingulatum lacks a prominent position in European folklore, mythology, or classical folk traditions, primarily owing to its specialized wetland habitat and subtle appearance. Historical interest in the species has been overwhelmingly scientific and taxonomic rather than folkloric. It was formally described in the nineteenth century by European mycologists, notably Karl Kalchbrenner and Elias Magnus Fries, who recognized its unique position among the genus Tricholoma due to the presence of a distinct membranous ring—an uncommon morphological feature reflected in its Latin epithet 'cingulatum', meaning girdled or belted. In nineteenth- and early twentieth-century botanical surveys across Britain, Germany, and Scandinavia, the species served as an indicator taxon in natural history literature, celebrated by local naturalists as an exquisite botanical marker of pristine willow fens and riparian wetlands. While absent from general literature, poetry, and folk superstition, the fungus holds cultural significance within European amateur mycological societies, where recording its presence during autumn fungus forays has historically represented a cherished milestone in documenting regional wetland biodiversity.
Edibility and safety
Tricholoma cingulatum is traditionally considered an edible mushroom in European field guides, though it holds little culinary value. Recent mycological literature advises against consuming species within the Tricholoma terreum complex; however, these represent differing assessments and do not demonstrate toxicity in T. cingulatum. The flesh possesses a distinct farinaceous (mealy) smell and taste that can become unpleasant or slightly bitter with age. Thorough cooking is strictly required prior to any consumption, as raw fruiting bodies contain indigestible substances capable of causing mild gastrointestinal upset. Safe preparation involves thorough boiling or sautéing, with the cooking water typically discarded to reduce the strong mealy odor. In Central and Eastern Europe, experienced foragers occasionally gather young specimens for mixed mushroom dishes or pickling, whereas in Western and Northern Europe, it is almost entirely ignored due to its mediocre culinary qualities, small size, and relative scarcity. Overmature, soft, or waterlogged specimens must be strictly avoided, as they deteriorate quickly and can harbor harmful bacterial contamination.
Habitat and occurrence
Tricholoma cingulatum is native to the temperate and hemiboreal zones of Europe and parts of Northern Asia, with localized records in North America. It is strictly tied to wetland and damp habitats, including willow carrs, riverbanks, lakeshores, marsh margins, fen edges, damp dune slacks, and periodically flooded alluvial plains. It also occurs in urban and anthropogenic sites such as damp parkland, drainage ditches, and former gravel pits where host trees have established. The species forms strict ectomycorrhizal partnerships exclusively with various willow species (Salix), including weeping willow (Salix babylonica), crack willow (Salix fragilis), white willow (Salix alba), and creeping willow (Salix repens). It grows in moist mineral, loamy, sandy, or peaty soils, often among mosses and herbaceous wetland vegetation. The fruiting season extends from late summer through late autumn, typically beginning in August or September and concluding in November or early December before sustained ground frosts. In Atlantic and maritime northwestern Europe, fruiting persists well into late November during mild seasons, whereas in continental and northern European regions, the season is compressed into a shorter window peaking in September and October.
Sources
- ČMS — odczytano opis gatunkowy, występowanie, oceny i listę obserwacji; nie przeczytano całej cytowanej bibliografii.
- Mehmood i in. 2022, Kavaka58(1): 29–32 — odczytano czterostronicowy artykuł; cechy kolekcji z Indii pozostają w profiluIN.
- Leake iin. 2004 — ukierunkowanyodczytMethods, Results, Table5iFig1l;rootpartnerSalixrepens, nieSalixcaprea;wyciągniejestsurowymPDF
Researcher
Edibility and culinary use
Source findings: edibility, consumption, and use
- Edibility
- Edible — identification source
ČMS — odczytano opis gatunkowy, występowanie, oceny i listę obserwacji; nie przeczytano całej cytowanej bibliografii. · Culinary use: In atlases it is usually marked as edible; current group reservation retained in Researcher.
- Required processing
- Requires preparation
FAQ gatunku: obróbka termiczna · literal_statements/0 and/1: heat treatment requirement in FAQ. This is a record of editorial content, not the result of a toxicological experiment.
Scientific names and taxonomy
- Current scientific name
Tricholoma cingulatum
- Zakres ujęcia taksonomicznego
Tricholoma cingulatum w zakresie identyfikacji przedstawionych w źródłach. Zaakceptowany gatunek GBIF 5241744, Index Fungorum 173032. Materiał z Indii i Chin zachowuje własne pochodzenie i metody; atlasom, fotografiom i dawnym polskim zapisom nie przypisano niezależnej identyfikacji DNA.
[29] [32]
Ecology and distribution
- Occurrence frequency
- Netherlands: Occurrence frequency: common. [17]
Laboratory diagnostics
Structured data
Basidia
Hymenial cystidia
Remaining laboratory characters
- Length
- Length: 35–150 µm. [8]
- Wall thickness
- Wall thickness: 1 µm (approximate value). [8]
Wall thickness: 0.5–1 µm (approximate value). [8] - Wall thickness — qualitative assessment
- Wall thickness — qualitative assessment: thin-walled. [33]
Wall thickness — qualitative assessment: thin-walled. [8]
Wall thickness — qualitative assessment: thick-walled (slightly). [8] - Subhymenium structure
- Subhymenium structure: filamentous. [8]
Pileipellis
- Optical appearance of pileipellis hyphae
- Optical appearance of pileipellis hyphae: hyaline. [8]
- Arrangement of pileipellis hyphae
- Arrangement of pileipellis hyphae: radial. [8]
Arrangement of pileipellis hyphae: interwoven. [8] - Length of pileipellis elements
- Length of pileipellis elements: 50–180 µm. [33]
- Width of pileipellis elements
- Width of pileipellis elements: 4–10 µm. [8]
Width of pileipellis elements: 4–8 µm. [33]
Reactions with reagents
Spores
- Mean spore length-to-width ratio
- Mean spore length-to-width ratio: 1.7 (standard deviation: 0.15, mean). [8] [7]
- Presence of the basidiospore hilar appendix
- Presence of the basidiospore hilar appendix: present (relatively large). [8]
- Spore colour under the microscope
- Spore colour under the microscope: hyaline. [5]
Spore colour under the microscope: hyaline. [8] - Spore length
- Spore length: 4.5–6 µm. [5]
Spore length: 5.5–7.2 µm. [33]
Spore length: 4–6.5 µm. [8]
Spore length: 5.2 µm (mean). [8] - Spore length-to-width ratio
- Spore length-to-width ratio: 1.4–2. [8]
Spore length-to-width ratio: 1.25–1.38. [33] - Spore shape
- Spore shape: ellipsoid. [5]
Spore shape: cylindrical. [5]
Spore shape: ellipsoid (broad). [33]
Spore shape: ellipsoid. [8]
Spore shape: ellipsoid (elongated). [8] - Spore wall thickness
- Spore wall thickness: thin-walled. [8]
Hymenophoral trama
Material and research methods
Microscopic data — source and limitations
Material: Sample [61/3/2]: 61 spores from 3 basidiomata and 2 collections. The measurement set was not equated with the full list of specimens examined in the publication.
Reading scope: Source fragments.
A source fragment was read; the full text and methods were not verified.
Limitations: Sample mean and deviation are not individual Q boundaries.
- Results as recorded in the sources — Spores per basidium
- Liczba zarodników na jednej podstawce wynosi 4. [33] [8]
- Results as recorded in the sources — Width of trama hyphae
- Szerokość strzępek tramy może wynosić od 4 do 10 mikrometrów. [33]
Szerokość strzępek tramy może wynosić od 4 do 7 mikrometrów. [8] - Results as recorded in the sources — Spore length
- 4,5–6 µm [5]
Materiał badania: Chiny — źródłowa próba [61/3/2]: 61 bazydiospor z 3 owocników z 2 kolekcji. Ryc. 93 przedstawia HKAS106635; nie przypisuje całej próby tylko temu okazowi. Wykaz badanego materiału zawiera także inne zbiory; nie utożsamiono ich z mianownikiem pomiarów. Średnia długość zarodnika w badanym materiale wynosi 5,2 mikrometra. [8]
4–6,5 µm [8]
5,5–7,2 µm [33] - Results as recorded in the sources — Spore width
- 2,5–3,5 µm [5]
2,5–4 µm [8]
Materiał badania: Chiny — źródłowa próba [61/3/2]: 61 bazydiospor z 3 owocników z 2 kolekcji. Ryc. 93 przedstawia HKAS106635; nie przypisuje całej próby tylko temu okazowi. Wykaz badanego materiału zawiera także inne zbiory; nie utożsamiono ich z mianownikiem pomiarów. Średnia szerokość zarodnika w badanym materiale wynosi 3,1 mikrometra. [8]
3–4,2 µm [33]
Metody i zapisy źródłowe — Indie, Drass, Bhimbat, Kargil, Ladakh — TMKVYPS21-39 (19.08.2021) i 21-43 (20.08.2021). Źródło podaje n = 20 zarodników bez rozstrzygnięcia podziału próby między kolekcje.
Metoda źródłowa. Technika: mikroskopia świetlna (LM). Medium: KOH. Stężenie: 5%. Opis metody w źródle: Ręczne skrawki; mikroskop CH20i, rysunki camera lucida przy powiększeniu 2000×, fotomikrografie Olympus CX33. Odczynniki należą do metody, nie warunków cech biologicznych. Barwienie: Congo red 1%.
Wygląd optyczny podstawki — zapis źródłowy: „Druk30/PDF2:hyaline.” [33]
Długość sterygmy podstawki — zapis źródłowy: „Druk30/PDF2:sterigmata2–3µm.” [33]
Liczba zarodników na jednej podstawce — zapis źródłowy: „Druk30/PDF2:4-spored; jeden bezwarunkowy zakresmin–max.” [33]
Długość podstawki; Szerokość podstawki — zapis źródłowy: „Druk30/PDF2:Basidia15–30×8–10µm.” [33]
Kształt podstawki — zapis źródłowy: „Druk30/PDF2:clavate.” [33]
Kształt podstawki — zapis źródłowy: „Druk30/PDF2:subclavate.” [33]
Typ tramy hymenoforu — zapis źródłowy: „Druk30/PDF2:Lamellartramaregular.” [33]
Wygląd optyczny strzępek tramy — zapis źródłowy: „Druk30/PDF2:colourlesshyphae.” [33]
Klasa ściany strzępek tramy — zapis źródłowy: „Druk30/PDF2:thin-walledhyphae.” [33]
Szerokość strzępek tramy — zapis źródłowy: „Druk30/PDF2:hyphae4–10µm.” [33]
Grubość ściany — ocena jakościowa — zapis źródłowy: „Druk30/PDF2:Basidiathin-walled.” [33]
Długość elementów skórki kapelusza; Szerokość elementów skórki — zapis źródłowy: „Druk30/PDF2:filamentoushyphae50–180×4–8µm.” [33]
Organizacja skórki kapelusza — zapis źródłowy: „Druk30/PDF2:pileipellisiscutis.” [33]
Długość zarodnika — zapis źródłowy: „Druk30/PDF2:5.5–6.2–7.2µm,n20; środkowa liczba zachowana w oryginale bez arbitralnego oznaczenia statystyki.” [33]
Iloraz długości i szerokości zarodnika — zapis źródłowy: „Druk30/PDF2:Q1.25–1.31–1.38; wartości krańcowe bez wyliczenia własnegoQ.” [33]
Kształt zarodnika — zapis źródłowy: „Druk30/PDF2:broadlyellipsoid.” [33]
Szerokość zarodnika — zapis źródłowy: „Druk30/PDF2:3.0–3.5–4.2µm,n20.” [33]
Metody i zapisy źródłowe — Chiny — źródłowa próba [61/3/2]: 61 bazydiospor z 3 owocników z 2 kolekcji. Ryc. 93 przedstawia HKAS106635; nie przypisuje całej próby tylko temu okazowi. Wykaz badanego materiału zawiera także inne zbiory; nie utożsamiono ich z mianownikiem pomiarów.
Wygląd optyczny podstawki — zapis źródłowy: „Section74:hyaline.” [8]
Wygląd optyczny strzępek skórki — zapis źródłowy: „Section74:colorlesshyphae.” [8]
Układ strzępek skórki — zapis źródłowy: „Section74:radialtointerwovenhyphae.” [8]
Długość sterygmy podstawki — zapis źródłowy: „Section74:sterigmata4–6µm.” [8]
Liczba zarodników na jednej podstawce — zapis źródłowy: „Section74:4-spored; bezwarunkowemin–max.” [8]
Obecność wyrostka wnęki bazydiospory; Długość; Kształt; Grubość ściany; Grubość ściany — ocena jakościowa; Szerokość; Organizacja skórki kapelusza; Budowa subhymenium — zapis źródłowy: „Section74:Lamellartrama” [8]
Długość podstawki; Szerokość podstawki — zapis źródłowy: „Section74:basidia20–30×5–7µm.” [8]
Kształt podstawki — zapis źródłowy: „Section74:clavate.” [8]
Stopień zróżnicowania cystyd — zapis źródłowy: „Section74:Cheilocystidiapoorlydifferentiated.” [8]
Typ tramy hymenoforu — zapis źródłowy: „Section74:lamellartramaregular.” [8]
Szerokość strzępek tramy — zapis źródłowy: „Section74:filamentoushyphae4–7µm.” [8]
Szerokość — zapis źródłowy: „Section74:subhymeniumcomposedof2–4µmwidefilamentoushyphae.” [8]
Szerokość elementów skórki — zapis źródłowy: „Section74:hyphae4–10µm.” [8]
Barwa strzępek skórki kapelusza — zapis źródłowy: „Section74:yellowbrown.” [8]
Barwa strzępek skórki kapelusza — zapis źródłowy: „Section74:brownish.” [8]
Obecność pleurocystyd — zapis źródłowy: „Section74:pleurocystidiaabsent.” [8]
Barwa zarodnika w mikroskopie — zapis źródłowy: „Section74:colorless,hyaline.” [8]
Długość zarodnika — zapis źródłowy: „Section74:(4–)4.5–6(–6.5)µm; pełne krańce, co najmniej90%w4.5–6.” [8]
Długość zarodnika — zapis źródłowy: „Section74:meanlength5.2µm.” [8]
Iloraz długości i szerokości zarodnika — zapis źródłowy: „Section74:Q1.4–2.” [8]
Kształt zarodnika — zapis źródłowy: „Section74:ellipsoidtoelongate.” [8]
Kształt zarodnika — zapis źródłowy: „Section74:elongate.” [8]
Powierzchnia zarodnika — zapis źródłowy: „Section74:smooth.” [8]
Grubość ściany zarodnika — zapis źródłowy: „Section74:thin-walled.” [8]
Szerokość zarodnika — zapis źródłowy: „Section74:(2.5–)3–4µm;pełnekrańce.” [8]
Szerokość zarodnika — zapis źródłowy: „Section74:meanwidth3.1µm.” [8]
Metody i zapisy źródłowe — ČMS — atlasowy opis zarodników; bez podanej próby i protokołu, pochodzenie materiału niepodane.
Barwa zarodnika w mikroskopie — zapis źródłowy: „Popis:průsvitné.” [5]
Długość zarodnika; Szerokość zarodnika — zapis źródłowy: „Popis:4,5–6×2,5–3,5µm.” [5]
Kształt zarodnika — zapis źródłowy: „Popis:elipsoidní.” [5]
Kształt zarodnika — zapis źródłowy: „Popis:částečněválcovité; źródłowa część zbioru, nie wszystkie zarodniki.” [5]
Powierzchnia zarodnika — zapis źródłowy: „Popis:hladké.” [5]
Zakres opisów i ocen
Połączenie blaszek: ČMS opisuje blaszki jako wycięte przy trzonie, z krótkim ząbkiem. Mehmood i in. (2022) nazywają je wolnymi. Drugi zapis dotyczy indyjskich kolekcji TMKVYPS21-39 i 21-43; nie zastąpiono nim opisu europejskiego ani nie scalono obu stanów w bezwarunkowy wariant.
Oceny kulinarne: ČMS podaje, że atlasy określają gatunek jako jadalny, ale odradza spożywanie grzybów z okręgu gąski ziemistej. To rekomendacja dotycząca grupy, a nie przedstawiony tam test toksyczności gąski wierzbowej. W odczytanym zbiorze źródeł nie znaleziono bezpośredniego eksperymentu tego gatunku potwierdzającego mechanizm termolabilnych substancji drażniących i neutralizację przez odlanie wody. To zakres przeprowadzonego przeglądu, nie dowód nieistnienia takich badań.
Wierzby i sąsiedztwo drzew: Źródło chińskie wyraźnie odróżnia europejskie powiązanie z wierzbami od znalezisk w chińskich lasach Fagaceae i Pinaceae. Skład drzewostanu nie dowodzi mikoryzy z każdym wymienionym drzewem. Tak samo wpisy o brzozach i topolach w grzyby.pl oraz artykule indyjskim zachowano jako obserwacje siedliskowe; nie dopisano z nich nowych potwierdzonych partnerów korzeniowych.
Materials and methods
India: Mehmood et al. (2022) described two collections from Bhimbat in Drass, 19 and 20 August 2021, TMKVYPS21-39 and 21–43. They reported n = 20 spores, without an explicit breakdown of the sample between collections. Sections were examined in 5% KOH and 1% Congo red. Three-part records of dimensions and Q were preserved in the source; in the absence of a definition of the middle statistic, it was not arbitrarily labeled as the mean. Sequence OM977115 from 21–39 showed 100% similarity to MW628104. In the text, the methods indicate MEGA-X, while the figure caption states MEGA6.0; the discrepancy remains with the study.
China: Cui et al. (2026), section 74: the sample [61/3/2] denotes 61 spores from 3 basidiomata and 2 collections. At least 90% of the length measurements fall within 4,5–6 µm, with extreme ranges of 4–6,5 µm; width has extreme ranges of 2,5–4 µm. Qm 1,7 ± 0,15 is the mean with standard deviation of the sample. Mounts were prepared in 5% KOH, Congo red was used when necessary, and amyloid reaction was tested with Melzer's reagent. For other structures, phase contrast 1000× was also specified. SEM was not attributed to this species by default. Fig. 93 originates from HKAS106635 and does not independently identify the entire sample.
Northern Europe: Heilmann-Clausen et al. (2017) state in their general method at least 20 randomly selected spores per collection and mounts in 2% KOH or 5–10% NH3. Neither n = 20 nor both media simultaneously were arbitrarily attributed to this species. Table 1 links named collections from Slovakia, Denmark, and the Netherlands to specimen and sequence numbers; years and collection codes alone do not define fruiting months.
Read localities
Poland: The full grzyby.pl card contains 15 dated GRej entries, including repeat confirmations of localities. These are local observations from 2006 to 2023, not an assessment of abundance for all of Poland. Selected dates include October, November, and 6 December 2020 near Dębogóra. Wojewoda (2003), entry T. cingulatum, describes a collection from the Batowice Cemetery in Kraków from 1998 and gives October; under T. ramentaceum he cites a historical record from Puszcza Bukowa, from Szczecin and the surrounding area. Publication dates were not transposed to collection dates. Voivodeships and exact localities without a matching common identifier remain in the preserved record.
Foreign scope: The 2017 analysis includes collections MC03-252 from Havešová in Slovakia, Danish neotype MC96-134, another Danish collection MC96-170 from Borum, and Dutch MEN95210 from Boekweitveentje in Drenthe. Chinese material includes Sichuan (Kangding/Gonggashan, 2700 m; Pingwu, 2500 m) and Yunnan (Shangri-La/Wongshui, 3400 m). The Indian paper also lists European countries based on older literature; the cited books were not automatically read in their entirety, nor was this list considered an up-to-date complete distribution range.
Proof of mycorrhiza with willow
Examined root: Leake et al. (2004) described ectomycorrhizal root tips of creeping willow Salix repens at Newborough Warren. Three groups of root samples were examined; the authors observed mycorrhizal mantles and rhizomorph connections, and the samples exhibited an ITS-RFLP type I profile consistent with the studied Monotropa symbiont. This is evidence extending beyond mere tree proximity. Table 5 gives Salix “nd” for mtLSU and the ITS region for these three samples, which therefore does not represent three independently sequenced samples. The species of the shared type was determined based on representative sequences and comparison with basidiomata.
Partner scope: This direct evidence pertains to Salix repens. The record regarding Salix caprea at Millers Dale describes Monotropa growing under willow and does not present a separate root analysis for that willow. The data record the available genus Salix; the exact species name of the creeping willow remains with the study. Not all willow species or other trees mentioned in habitat descriptions were confirmed by this method.
Screening of extracts
Material 46/07: Otto (2017), appendix A3, notes material T. cingulatum 46/07 marked “fr”. For methanol and ethyl acetate extracts, the table reports no inhibition across three assays labeled SEPTTR, PHYTIN, and CLADCU. In the BOTRCI column, “n.t.” is listed — not tested; this entry was not converted into a negative result. These are qualitative findings for specific material and tests, without inferences regarding utilitarian or medicinal use of the species.
Data limitations: From the read extract, concentrations, number of replicates, numerical endpoint, herbarium specimen number, and collection locality could not be established. Not all test organism codes were automatically deciphered. The direct repository link returned an HTML page instead of a PDF; the preserved table reading is not a declaration of having read the entire thesis. Results were not extrapolated to cooked basidiomata, food safety, or clinical efficacy.
Material composition from Kargil — study scope
Material and replicates: Mayirnao et al. (2025) collected mature basidiocarps in Drass, Kargil district, in September 2022, at an altitude of 3276 m a.s.l. The GC–MS metabolite profile, dry weight determinations, and molar ratios were separated. Three replicates of the assays do not determine the number of independent basidiocarps. For detailed protocols and molecular identification, the authors refer to the supplement; the supplement was not read.
Significance of percentages: Table 1 reports the percentage composition of the GC–MS metabolite profile. This is not the mass percentage of a constituent in the basidiocarp. Each reading in column T. cingulatum and the source SDs were retained. Non-detection results remain separate: Tyrosine, Glycyl glycine, Homoserine, Ornithine, Dodecanamide, Niacin, Phosphinoline ethanamine, Arabinopyranose, Galactose, Maltose, Mannitol, Arachidic acid, Lignoceric acid, Margaric acid, Linoelaidic acid, Ricinoleic acid, Eicosatrienoic acid, Linoleoylglycerol, Hydroxyandrosterone, Pimelic acid, β-sitosterol, Suberic acid, Tetracosane, Ascorbic acid, Hydroxyglutaric acid, Salicylic acid. Non-detection by a given method does not imply the absolute absence of a substance. Hydroxyglutaric acid appears in the table in two different rows; the differing quantitative entry and non-detection were not merged.
Antioxidant assays: In section 3.10, the authors reported for T. cingulatum IC50 = 9,03 mg/ml in the hydrogen peroxide scavenging assay and 5,52 mg/ml in the potassium ferricyanide reduction assay. These are test results, not confirmation of treatment, supplementation, or safety of consumption. The main text does not resolve all assay protocol details; they were not replaced with the DPPH assay or another endpoint. The abstract highlighted the reducing activity of V. bombycina, despite a lower value reported for T. cingulatum in the results section.
Occurrence verification — scope and limitations
Material: Dokładny zapis źródłowy dla BG
Scope of reading: Source excerpts.
A source excerpt was read; the full text and methods were not verified.
Review date: 10.11.2026.
Limitations: The scope derives from the cited source; without extrapolation to other areas or periods.
Scope of study
Before completion, the record requires completion or settlement.
- New sources require accounting for information encountered during the review.
Legal basis and scope of assessment
Regulations for location: Poland
Basis of protection information
The species is not listed in the annexes of the regulation on species protection of fungi (Dz.U.2014/1408).
Basis of trade information
The species is not listed in the list of mushrooms permitted for marketing or processing (Dz.U.2026/258,załącznik1); this is not an edibility classification.
Analytical results
Separate source analytical results
- Isoleucine — share in GC–MS profile
- The determination result is 0,59 % of the GC–MS profile. Mass basis was not specified in the source. Uncertainty: 0,14 % of the GC–MS profile (standard deviation). Statistic: mean. n = 3 (replicates stated in the source; biochemical measurements). Method according to the source: GC–MS after MSTFA derivatization; percentage composition of metabolite profile according to table 1.[36] [37]
- Leucine — share in GC–MS profile
- The determination result is 0,44 % of the GC–MS profile. Mass basis was not specified in the source. Uncertainty: 0,08 % of the GC–MS profile (standard deviation). Statistic: mean. n = 3 (replicates stated in the source; biochemical measurements). Method according to the source: GC–MS after MSTFA derivatization; percentage composition of metabolite profile according to table 1.[36] [37]
- Lysine — share in GC–MS profile
- The determination result is 0,65 % of the GC–MS profile. Mass basis was not specified in the source. Uncertainty: 0,04 % of the GC–MS profile (standard deviation). Statistic: mean. n = 3 (replicates stated in the source; biochemical measurements). Method according to the source: GC–MS after MSTFA derivatization; percentage composition of metabolite profile according to table 1.[36] [37]
- Phenylalanine — share in GC–MS profile
- The determination result is 0,58 % of the GC–MS profile. Mass basis was not specified in the source. Uncertainty: 0,15 % of the GC–MS profile (standard deviation). Statistic: mean. n = 3 (replicates stated in the source; biochemical measurements). Method according to the source: GC–MS after MSTFA derivatization; percentage composition of metabolite profile according to table 1.[36] [37]
- Threonine — share in GC–MS profile
- The determination result is 2,22 % of the GC–MS profile. Mass basis was not specified in the source. Uncertainty: 0,45 % of the GC–MS profile (standard deviation). Statistic: mean. n = 3 (replicates stated in the source; biochemical measurements). Method according to the source: GC–MS after MSTFA derivatization; percentage composition of metabolite profile according to table 1.[36] [37]
- Valine — share in GC–MS profile
- The determination result is 1,12 % of the GC–MS profile. Mass basis was not specified in the source. Uncertainty: 0,09 % of the GC–MS profile (standard deviation). Statistic: mean. n = 3 (replicates stated in the source; biochemical measurements). Method according to the source: GC–MS after MSTFA derivatization; percentage composition of metabolite profile according to table 1.[36] [37]
- Alanine — share in GC–MS profile
- The determination result is 2,64 % of the GC–MS profile. Mass basis was not specified in the source. Uncertainty: 0,59 % of the GC–MS profile (standard deviation). Statistic: mean. n = 3 (replicates stated in the source; biochemical measurements). Method according to the source: GC–MS after MSTFA derivatization; percentage composition of metabolite profile according to table 1.[36] [37]
- Asparagine — share in GC–MS profile
- The determination result is 0,14 % of the GC–MS profile. Mass basis was not specified in the source. Uncertainty: 0,01 % of the GC–MS profile (standard deviation). Statistic: mean. n = 3 (replicates stated in the source; biochemical measurements). Method according to the source: GC–MS after MSTFA derivatization; percentage composition of metabolite profile according to table 1.[36] [37]
- Aspartic acid — share in GC–MS profile
- The determination result is 0,26 % of the GC–MS profile. Mass basis was not specified in the source. Uncertainty: 0,07 % of the GC–MS profile (standard deviation). Statistic: mean. n = 3 (replicates stated in the source; biochemical measurements). Method according to the source: GC–MS after MSTFA derivatization; percentage composition of metabolite profile according to table 1.[36] [37]
- Glutamic acid — share in GC–MS profile
- The determination result is 0,98 % of the GC–MS profile. Mass basis was not specified in the source. Uncertainty: 0,35 % of the GC–MS profile (standard deviation). Statistic: mean. n = 3 (replicates stated in the source; biochemical measurements). Method according to the source: GC–MS after MSTFA derivatization; percentage composition of metabolite profile according to table 1.[36] [37]
- Glycine — share in GC–MS profile
- The determination result is 2,11 % of the GC–MS profile. Mass basis was not specified in the source. Uncertainty: 0,78 % of the GC–MS profile (standard deviation). Statistic: mean. n = 3 (replicates stated in the source; biochemical measurements). Method according to the source: GC–MS after MSTFA derivatization; percentage composition of metabolite profile according to table 1.[36] [37]
- Proline — share in GC–MS profile
- The determination result is 0,59 % of the GC–MS profile. Mass basis was not specified in the source. Uncertainty: 0,28 % of the GC–MS profile (standard deviation). Statistic: mean. n = 3 (replicates stated in the source; biochemical measurements). Method according to the source: GC–MS after MSTFA derivatization; percentage composition of metabolite profile according to table 1.[36] [37]
- Serine — share in GC–MS profile
- The determination result is 1,0 % of the GC–MS profile. Mass basis was not specified in the source. Uncertainty: 0,14 % of the GC–MS profile (standard deviation). Statistic: mean. n = 3 (replicates stated in the source; biochemical measurements). Method according to the source: GC–MS after MSTFA derivatization; percentage composition of metabolite profile according to table 1.[36] [37]
- Acetyllysine — share in GC–MS profile
- The determination result is 0,21 % of the GC–MS profile. Mass basis was not specified in the source. Uncertainty: 0,03 % of the GC–MS profile (standard deviation). Statistic: mean. n = 3 (replicates stated in the source; biochemical measurements). Method according to the source: GC–MS after MSTFA derivatization; percentage composition of metabolite profile according to table 1.[36] [37]
- Ergothioneine — share in GC–MS profile
- The determination result is 0,16 % of the GC–MS profile. Mass basis was not specified in the source. Uncertainty: 0,03 % of the GC–MS profile (standard deviation). Statistic: mean. n = 3 (replicates stated in the source; biochemical measurements). Method according to the source: GC–MS after MSTFA derivatization; percentage composition of metabolite profile according to table 1.[36] [37]
- Glycylproline — share in GC–MS profile
- The determination result is 0,81 % of the GC–MS profile. Mass basis was not specified in the source. Uncertainty: 0,16 % of the GC–MS profile (standard deviation). Statistic: mean. n = 3 (replicates stated in the source; biochemical measurements). Method according to the source: GC–MS after MSTFA derivatization; percentage composition of metabolite profile according to table 1.[36] [37]
- 5-oxoproline — share in GC–MS profile
- The determination result is 7,95 % of the GC–MS profile. Mass basis was not specified in the source. Uncertainty: 0,04 % of the GC–MS profile (standard deviation). Statistic: mean. n = 3 (replicates stated in the source; biochemical measurements). Method according to the source: GC–MS after MSTFA derivatization; percentage composition of metabolite profile according to table 1.[36] [37]
- Adenosine — share in GC–MS profile
- The determination result is 0,27 % of the GC–MS profile. Mass basis was not specified in the source. Uncertainty: 0,1 % of the GC–MS profile (standard deviation). Statistic: mean. n = 3 (replicates stated in the source; biochemical measurements). Method according to the source: GC–MS after MSTFA derivatization; percentage composition of metabolite profile according to table 1.[36] [37]
- Ethanolamine — share in GC–MS profile
- The determination result is 1,36 % of the GC–MS profile. Mass basis was not specified in the source. Uncertainty: 0,28 % of the GC–MS profile (standard deviation). Statistic: mean. n = 3 (replicates stated in the source; biochemical measurements). Method according to the source: GC–MS after MSTFA derivatization; percentage composition of metabolite profile according to table 1.[36] [37]
- Methyladenosine — share in GC–MS profile
- The determination result is 0,19 % of the GC–MS profile. Mass basis was not specified in the source. Uncertainty: 0,01 % of the GC–MS profile (standard deviation). Statistic: mean. n = 3 (replicates stated in the source; biochemical measurements). Method according to the source: GC–MS after MSTFA derivatization; percentage composition of metabolite profile according to table 1.[36] [37]
- Uracil — share in GC–MS profile
- The determination result is 0,59 % of the GC–MS profile. Mass basis was not specified in the source. Uncertainty: 0,22 % of the GC–MS profile (standard deviation). Statistic: mean. n = 3 (replicates stated in the source; biochemical measurements). Method according to the source: GC–MS after MSTFA derivatization; percentage composition of metabolite profile according to table 1.[36] [37]
- Urea — share in GC–MS profile
- The determination result is 1,88 % of the GC–MS profile. Mass basis was not specified in the source. Uncertainty: 0,12 % of the GC–MS profile (standard deviation). Statistic: mean. n = 3 (replicates stated in the source; biochemical measurements). Method according to the source: GC–MS after MSTFA derivatization; percentage composition of metabolite profile according to table 1.[36] [37]
- Uridine — share in GC–MS profile
- The determination result is 1,04 % of the GC–MS profile. Mass basis was not specified in the source. Uncertainty: 0,17 % of the GC–MS profile (standard deviation). Statistic: mean. n = 3 (replicates stated in the source; biochemical measurements). Method according to the source: GC–MS after MSTFA derivatization; percentage composition of metabolite profile according to table 1.[36] [37]
- Deoxygalactose — share in GC–MS profile
- The determination result is 0,04 % of the GC–MS profile. Mass basis was not specified in the source. Uncertainty: 0,01 % of the GC–MS profile (standard deviation). Statistic: mean. n = 3 (replicates stated in the source; biochemical measurements). Method according to the source: GC–MS after MSTFA derivatization; percentage composition of metabolite profile according to table 1.[36] [37]
- Erythrose — share in GC–MS profile
- The determination result is 0,2 % of the GC–MS profile. Mass basis was not specified in the source. Uncertainty: 0,05 % of the GC–MS profile (standard deviation). Statistic: mean. n = 3 (replicates stated in the source; biochemical measurements). Method according to the source: GC–MS after MSTFA derivatization; percentage composition of metabolite profile according to table 1.[36] [37]
- Fructose — share in GC–MS profile
- The determination result is 1,55 % of the GC–MS profile. Mass basis was not specified in the source. Uncertainty: 0,41 % of the GC–MS profile (standard deviation). Statistic: mean. n = 3 (replicates stated in the source; biochemical measurements). Method according to the source: GC–MS after MSTFA derivatization; percentage composition of metabolite profile according to table 1.[36] [37]
- Fructopyranose — share in GC–MS profile
- The determination result is 0,42 % of the GC–MS profile. Mass basis was not specified in the source. Uncertainty: 0,06 % of the GC–MS profile (standard deviation). Statistic: mean. n = 3 (replicates stated in the source; biochemical measurements). Method according to the source: GC–MS after MSTFA derivatization; percentage composition of metabolite profile according to table 1.[36] [37]
- Talose — share in GC–MS profile
- The determination result is 0,86 % of the GC–MS profile. Mass basis was not specified in the source. Uncertainty: 0,06 % of the GC–MS profile (standard deviation). Statistic: mean. n = 3 (replicates stated in the source; biochemical measurements). Method according to the source: GC–MS after MSTFA derivatization; percentage composition of metabolite profile according to table 1.[36] [37]
- Trehalose — share in GC–MS profile
- The determination result is 18,67 % of the GC–MS profile. Mass basis was not specified in the source. Uncertainty: 0,69 % of the GC–MS profile (standard deviation). Statistic: mean. n = 3 (replicates stated in the source; biochemical measurements). Method according to the source: GC–MS after MSTFA derivatization; percentage composition of metabolite profile according to table 1.[36] [37]
- Xylulose — share in GC–MS profile
- The determination result is 0,25 % of the GC–MS profile. Mass basis was not specified in the source. Uncertainty: 0,08 % of the GC–MS profile (standard deviation). Statistic: mean. n = 3 (replicates stated in the source; biochemical measurements). Method according to the source: GC–MS after MSTFA derivatization; percentage composition of metabolite profile according to table 1.[36] [37]
- α-mannobiose — share in GC–MS profile
- The determination result is 0,28 % of the GC–MS profile. Mass basis was not specified in the source. Uncertainty: 0,01 % of the GC–MS profile (standard deviation). Statistic: mean. n = 3 (replicates stated in the source; biochemical measurements). Method according to the source: GC–MS after MSTFA derivatization; percentage composition of metabolite profile according to table 1.[36] [37]
- Deoxytetronic acid — share in GC–MS profile
- The determination result is 0,22 % of the GC–MS profile. Mass basis was not specified in the source. Uncertainty: 0,04 % of the GC–MS profile (standard deviation). Statistic: mean. n = 3 (replicates stated in the source; biochemical measurements). Method according to the source: GC–MS after MSTFA derivatization; percentage composition of metabolite profile according to table 1.[36] [37]
- Gluconic acid — share in GC–MS profile
- The determination result is 1,55 % of the GC–MS profile. Mass basis was not specified in the source. Uncertainty: 0,26 % of the GC–MS profile (standard deviation). Statistic: mean. n = 3 (replicates stated in the source; biochemical measurements). Method according to the source: GC–MS after MSTFA derivatization; percentage composition of metabolite profile according to table 1.[36] [37]
- Glyceric acid — share in GC–MS profile
- The determination result is 0,62 % of the GC–MS profile. Mass basis was not specified in the source. Uncertainty: 0,23 % of the GC–MS profile (standard deviation). Statistic: mean. n = 3 (replicates stated in the source; biochemical measurements). Method according to the source: GC–MS after MSTFA derivatization; percentage composition of metabolite profile according to table 1.[36] [37]
- Hydroxyglutaric acid — share in GC–MS profile
- The determination result is 0,29 % of the GC–MS profile. Mass basis was not specified in the source. Uncertainty: 0,1 % of the GC–MS profile (standard deviation). Statistic: mean. n = 3 (replicates stated in the source; biochemical measurements). Method according to the source: GC–MS after MSTFA derivatization; percentage composition of metabolite profile according to table 1.[36] [37]
- Ribonic acid — share in GC–MS profile
- The determination result is 0,19 % of the GC–MS profile. Mass basis was not specified in the source. Uncertainty: 0,06 % of the GC–MS profile (standard deviation). Statistic: mean. n = 3 (replicates stated in the source; biochemical measurements). Method according to the source: GC–MS after MSTFA derivatization; percentage composition of metabolite profile according to table 1.[36] [37]
- Xylonic acid — share in GC–MS profile
- The determination result is 0,52 % of the GC–MS profile. Mass basis was not specified in the source. Uncertainty: 0,11 % of the GC–MS profile (standard deviation). Statistic: mean. n = 3 (replicates stated in the source; biochemical measurements). Method according to the source: GC–MS after MSTFA derivatization; percentage composition of metabolite profile according to table 1.[36] [37]
- Erythritol — share in GC–MS profile
- The determination result is 1,28 % of the GC–MS profile. Mass basis was not specified in the source. Uncertainty: 0,37 % of the GC–MS profile (standard deviation). Statistic: mean. n = 3 (replicates stated in the source; biochemical measurements). Method according to the source: GC–MS after MSTFA derivatization; percentage composition of metabolite profile according to table 1.[36] [37]
- Glucitol — share in GC–MS profile
- The determination result is 10,33 % of the GC–MS profile. Mass basis was not specified in the source. Uncertainty: 2,42 % of the GC–MS profile (standard deviation). Statistic: mean. n = 3 (replicates stated in the source; biochemical measurements). Method according to the source: GC–MS after MSTFA derivatization; percentage composition of metabolite profile according to table 1.[36] [37]
- Glycerol — share in GC–MS profile
- The determination result is 5,71 % of the GC–MS profile. Mass basis was not specified in the source. Uncertainty: 0,45 % of the GC–MS profile (standard deviation). Statistic: mean. n = 3 (replicates stated in the source; biochemical measurements). Method according to the source: GC–MS after MSTFA derivatization; percentage composition of metabolite profile according to table 1.[36] [37]
- Meso-erythritol — share in GC–MS profile
- The determination result is 0,05 % of the GC–MS profile. Mass basis was not specified in the source. Uncertainty: 0,03 % of the GC–MS profile (standard deviation). Statistic: mean. n = 3 (replicates stated in the source; biochemical measurements). Method according to the source: GC–MS after MSTFA derivatization; percentage composition of metabolite profile according to table 1.[36] [37]
- Myo-inositol — share in GC–MS profile
- The determination result is 1,05 % of the GC–MS profile. Mass basis was not specified in the source. Uncertainty: 0,2 % of the GC–MS profile (standard deviation). Statistic: mean. n = 3 (replicates stated in the source; biochemical measurements). Method according to the source: GC–MS after MSTFA derivatization; percentage composition of metabolite profile according to table 1.[36] [37]
- Ribitol — share in GC–MS profile
- The determination result is 2,36 % of the GC–MS profile. Mass basis was not specified in the source. Uncertainty: 0,18 % of the GC–MS profile (standard deviation). Statistic: mean. n = 3 (replicates stated in the source; biochemical measurements). Method according to the source: GC–MS after MSTFA derivatization; percentage composition of metabolite profile according to table 1.[36] [37]
- Myristic acid — share in GC–MS profile
- The determination result is 0,65 % of the GC–MS profile. Mass basis was not specified in the source. Uncertainty: 0,03 % of the GC–MS profile (standard deviation). Statistic: mean. n = 3 (replicates stated in the source; biochemical measurements). Method according to the source: GC–MS after MSTFA derivatization; percentage composition of metabolite profile according to table 1.[36] [37]
- Palmitic acid — share in GC–MS profile
- The determination result is 3,7 % of the GC–MS profile. Mass basis was not specified in the source. Uncertainty: 0,66 % of the GC–MS profile (standard deviation). Statistic: mean. n = 3 (replicates stated in the source; biochemical measurements). Method according to the source: GC–MS after MSTFA derivatization; percentage composition of metabolite profile according to table 1.[36] [37]
- Stearic acid — share in GC–MS profile
- The determination result is 1,8 % of the GC–MS profile. Mass basis was not specified in the source. Uncertainty: 0,41 % of the GC–MS profile (standard deviation). Statistic: mean. n = 3 (replicates stated in the source; biochemical measurements). Method according to the source: GC–MS after MSTFA derivatization; percentage composition of metabolite profile according to table 1.[36] [37]
- Oleic acid — share in GC–MS profile
- The determination result is 6,05 % of the GC–MS profile. Mass basis was not specified in the source. Uncertainty: 0,5 % of the GC–MS profile (standard deviation). Statistic: mean. n = 3 (replicates stated in the source; biochemical measurements). Method according to the source: GC–MS after MSTFA derivatization; percentage composition of metabolite profile according to table 1.[36] [37]
- Palmitelaidic acid — share in GC–MS profile
- The determination result is 0,22 % of the GC–MS profile. Mass basis was not specified in the source. Uncertainty: 0,11 % of the GC–MS profile (standard deviation). Statistic: mean. n = 3 (replicates stated in the source; biochemical measurements). Method according to the source: GC–MS after MSTFA derivatization; percentage composition of metabolite profile according to table 1.[36] [37]
- Monooleoylglycerol — share in GC–MS profile
- The determination result is 1,47 % of the GC–MS profile. Mass basis was not specified in the source. Uncertainty: 0,14 % of the GC–MS profile (standard deviation). Statistic: mean. n = 3 (replicates stated in the source; biochemical measurements). Method according to the source: GC–MS after MSTFA derivatization; percentage composition of metabolite profile according to table 1.[36] [37]
- Glycerol monopalmitate — share in GC–MS profile
- The determination result is 0,39 % of the GC–MS profile. Mass basis was not specified in the source. Uncertainty: 0,11 % of the GC–MS profile (standard deviation). Statistic: mean. n = 3 (replicates stated in the source; biochemical measurements). Method according to the source: GC–MS after MSTFA derivatization; percentage composition of metabolite profile according to table 1.[36] [37]
- Linoleic acid — share in GC–MS profile
- The determination result is 5,3 % of the GC–MS profile. Mass basis was not specified in the source. Uncertainty: 0,08 % of the GC–MS profile (standard deviation). Statistic: mean. n = 3 (replicates stated in the source; biochemical measurements). Method according to the source: GC–MS after MSTFA derivatization; percentage composition of metabolite profile according to table 1.[36] [37]
- Azelaic acid — share in GC–MS profile
- The determination result is 1,12 % of the GC–MS profile. Mass basis was not specified in the source. Uncertainty: 0,34 % of the GC–MS profile (standard deviation). Statistic: mean. n = 3 (replicates stated in the source; biochemical measurements). Method according to the source: GC–MS after MSTFA derivatization; percentage composition of metabolite profile according to table 1.[36] [37]
- Stigmasterol — share in GC–MS profile
- The determination result is 0,11 % of the GC–MS profile. Mass basis was not specified in the source. Uncertainty: 0,0 % of the GC–MS profile (standard deviation). Statistic: mean. n = 3 (replicates stated in the source; biochemical measurements). Method according to the source: GC–MS after MSTFA derivatization; percentage composition of metabolite profile according to table 1.[36] [37]
- Citric acid — share in GC–MS profile
- The determination result is 1,77 % of the GC–MS profile. Mass basis was not specified in the source. Uncertainty: 0,47 % of the GC–MS profile (standard deviation). Statistic: mean. n = 3 (replicates stated in the source; biochemical measurements). Method according to the source: GC–MS after MSTFA derivatization; percentage composition of metabolite profile according to table 1.[36] [37]
- Ethylmalonic acid — share in GC–MS profile
- The determination result is 0,29 % of the GC–MS profile. Mass basis was not specified in the source. Uncertainty: 0,11 % of the GC–MS profile (standard deviation). Statistic: mean. n = 3 (replicates stated in the source; biochemical measurements). Method according to the source: GC–MS after MSTFA derivatization; percentage composition of metabolite profile according to table 1.[36] [37]
- Fumaric acid — share in GC–MS profile
- The determination result is 1,15 % of the GC–MS profile. Mass basis was not specified in the source. Uncertainty: 0,13 % of the GC–MS profile (standard deviation). Statistic: mean. n = 3 (replicates stated in the source; biochemical measurements). Method according to the source: GC–MS after MSTFA derivatization; percentage composition of metabolite profile according to table 1.[36] [37]
- Hydroxymalonic acid — share in GC–MS profile
- The determination result is 0,34 % of the GC–MS profile. Mass basis was not specified in the source. Uncertainty: 0,04 % of the GC–MS profile (standard deviation). Statistic: mean. n = 3 (replicates stated in the source; biochemical measurements). Method according to the source: GC–MS after MSTFA derivatization; percentage composition of metabolite profile according to table 1.[36] [37]
- Maleic acid — share in GC–MS profile
- The determination result is 4,31 % of the GC–MS profile. Mass basis was not specified in the source. Uncertainty: 0,64 % of the GC–MS profile (standard deviation). Statistic: mean. n = 3 (replicates stated in the source; biochemical measurements). Method according to the source: GC–MS after MSTFA derivatization; percentage composition of metabolite profile according to table 1.[36] [37]
- Methylmaleic acid — share in GC–MS profile
- The determination result is 0,07 % of the GC–MS profile. Mass basis was not specified in the source. Uncertainty: 0,02 % of the GC–MS profile (standard deviation). Statistic: mean. n = 3 (replicates stated in the source; biochemical measurements). Method according to the source: GC–MS after MSTFA derivatization; percentage composition of metabolite profile according to table 1.[36] [37]
- Methylsuccinic acid — share in GC–MS profile
- The determination result is 0,23 % of the GC–MS profile. Mass basis was not specified in the source. Uncertainty: 0,04 % of the GC–MS profile (standard deviation). Statistic: mean. n = 3 (replicates stated in the source; biochemical measurements). Method according to the source: GC–MS after MSTFA derivatization; percentage composition of metabolite profile according to table 1.[36] [37]
- Pyruvic acid — share in GC–MS profile
- The determination result is 0,22 % of the GC–MS profile. Mass basis was not specified in the source. Uncertainty: 0,001 % of the GC–MS profile (standard deviation). Statistic: mean. n = 3 (replicates stated in the source; biochemical measurements). Method according to the source: GC–MS after MSTFA derivatization; percentage composition of metabolite profile according to table 1.[36] [37]
- Oxalic acid — share in GC–MS profile
- The determination result is 0,15 % of the GC–MS profile. Mass basis was not specified in the source. Uncertainty: 0,06 % of the GC–MS profile (standard deviation). Statistic: mean. n = 3 (replicates stated in the source; biochemical measurements). Method according to the source: GC–MS after MSTFA derivatization; percentage composition of metabolite profile according to table 1.[36] [37]
- Shikimic acid — share in GC–MS profile
- The determination result is 0,37 % of the GC–MS profile. Mass basis was not specified in the source. Uncertainty: 0,1 % of the GC–MS profile (standard deviation). Statistic: mean. n = 3 (replicates stated in the source; biochemical measurements). Method according to the source: GC–MS after MSTFA derivatization; percentage composition of metabolite profile according to table 1.[36] [37]
- Succinic acid — share in GC–MS profile
- The determination result is 1,0 % of the GC–MS profile. Mass basis was not specified in the source. Uncertainty: 0,17 % of the GC–MS profile (standard deviation). Statistic: mean. n = 3 (replicates stated in the source; biochemical measurements). Method according to the source: GC–MS after MSTFA derivatization; percentage composition of metabolite profile according to table 1.[36] [37]
- Phosphoric acid — share in GC–MS profile
- The determination result is 0,6 % of the GC–MS profile. Mass basis was not specified in the source. Uncertainty: 0,1 % of the GC–MS profile (standard deviation). Statistic: mean. n = 3 (replicates stated in the source; biochemical measurements). Method according to the source: GC–MS after MSTFA derivatization; percentage composition of metabolite profile according to table 1.[36] [37]
- Nitrogen
- The determination result is 12,84 mg/g. The result refers to dry matter of the examined material. Uncertainty: 0,35 mg/g (standard deviation). Statistic: mean. n = 3 (replicates stated in the source; biochemical measurements). Method according to the source: CHNS analyzer.[36] [37]
- Sulfur
- The determination result is 1,02 mg/g. The result refers to dry matter of the examined material. Uncertainty: 0,17 mg/g (standard deviation). Statistic: mean. n = 3 (replicates stated in the source; biochemical measurements). Method according to the source: CHNS analyzer.[36] [37]
- Phosphorus
- The determination result is 0,94 mg/g. The result refers to dry matter of the examined material. Uncertainty: 0,03 mg/g (standard deviation). Statistic: mean. n = 3 (replicates stated in the source; biochemical measurements). Method according to the source: detailed method for P was not unambiguously assigned in the read part of the methods.[36] [37]
- Sodium
- The determination result is 22,01 mg/g. The result refers to dry matter of the examined material. Uncertainty: 3,83 mg/g (standard deviation). Statistic: mean. n = 3 (replicates stated in the source; biochemical measurements). Method according to the source: flame photometry.[36] [37]
- Potassium
- The determination result is 31,2 mg/g. The result refers to dry matter of the examined material. Uncertainty: 0,75 mg/g (standard deviation). Statistic: mean. n = 3 (replicates stated in the source; biochemical measurements). Method according to the source: flame photometry.[36] [37]
- Calcium
- The determination result is 0,68 mg/g. The result refers to dry matter of the examined material. Uncertainty: 0,12 mg/g (standard deviation). Statistic: mean. n = 3 (replicates stated in the source; biochemical measurements). Method according to the source: atomic absorption spectrometry.[36] [37]
- Magnesium
- The determination result is 0,67 mg/g. The result refers to dry matter of the examined material. Uncertainty: 0,01 mg/g (standard deviation). Statistic: mean. n = 3 (replicates stated in the source; biochemical measurements). Method according to the source: atomic absorption spectrometry.[36] [37]
- Aluminum
- The determination result is 39,07 micrograms per gram. The result refers to dry matter of the examined material. Uncertainty: 3,26 micrograms per gram (standard deviation). Statistic: mean. n = 3 (replicates stated in the source; biochemical measurements). Method according to the source: atomic absorption spectrometry.[36] [37]
- Copper
- The determination result is 53,95 micrograms per gram. The result refers to dry matter of the examined material. Uncertainty: 2,4 micrograms per gram (standard deviation). Statistic: mean. n = 3 (replicates stated in the source; biochemical measurements). Method according to the source: atomic absorption spectrometry.[36] [37]
- Iron
- The determination result is 223,05 micrograms per gram. The result refers to dry matter of the examined material. Uncertainty: 38,74 micrograms per gram (standard deviation). Statistic: mean. n = 3 (replicates stated in the source; biochemical measurements). Method according to the source: atomic absorption spectrometry.[36] [37]
- Nickel
- The determination result is 22,41 micrograms per gram. The result refers to dry matter of the examined material. Uncertainty: 3,93 micrograms per gram (standard deviation). Statistic: mean. n = 3 (replicates stated in the source; biochemical measurements). Method according to the source: atomic absorption spectrometry.[36] [37]
- Chromium
- The determination result is 30,92 micrograms per gram. The result refers to dry matter of the examined material. Uncertainty: 2,94 micrograms per gram (standard deviation). Statistic: mean. n = 3 (replicates stated in the source; biochemical measurements). Method according to the source: ICP–MS.[36] [37]
- Manganese
- The determination result is 55,6 micrograms per gram. The result refers to dry matter of the examined material. Uncertainty: 5,75 micrograms per gram (standard deviation). Statistic: mean. n = 3 (replicates stated in the source; biochemical measurements). Method according to the source: ICP–MS.[36] [37]
- Selenium
- The determination result is 26,43 micrograms per gram. The result refers to dry matter of the examined material. Uncertainty: 1,09 micrograms per gram (standard deviation). Statistic: mean. n = 3 (replicates stated in the source; biochemical measurements). Method according to the source: ICP–MS.[36] [37]
- Molybdenum
- The determination result is 61,22 micrograms per gram. The result refers to dry matter of the examined material. Uncertainty: 5,91 micrograms per gram (standard deviation). Statistic: mean. n = 3 (replicates stated in the source; biochemical measurements). Method according to the source: ICP–MS.[36] [37]
- Zinc
- The determination result is 30,58 micrograms per gram. The result refers to dry matter of the examined material. Uncertainty: 4,77 micrograms per gram (standard deviation). Statistic: mean. n = 3 (replicates stated in the source; biochemical measurements). Method according to the source: atomic absorption spectrometry.[36] [37]
- Molar ratio OA/(Ca+Mg)
- The determination result is 0,4. Method according to the source: molar ratio reported by the authors; OA — oxalic acid, PA — phytic acid.[36] [37]
- Molar ratio PA/Fe
- The determination result is 0,16. Method according to the source: molar ratio reported by the authors; OA — oxalic acid, PA — phytic acid.[36] [37]
- Molar ratio PA/Ca
- The determination result is 0,13. Method according to the source: molar ratio reported by the authors; OA — oxalic acid, PA — phytic acid.[36] [37]
- Molar ratio PA/Zn
- The determination result is 6,33. Method according to the source: molar ratio reported by the authors; OA — oxalic acid, PA — phytic acid.[36] [37]
- Total protein
- The determination result is 312 mg/g. The result refers to dry matter of the examined material. Statistic: mean. n = 3 (replicates stated in the source; biochemical measurements). Method according to the source: Bradford method.[36] [37]
- Total phenols — Folin–Ciocalteu assay
- The determination result is 38,33 mg/g. The result refers to dry matter of the examined material. Statistic: mean. n = 3 (replicates stated in the source; biochemical measurements). Method according to the source: Folin–Ciocalteu method; calibrant is not unambiguously indicated in the read part of the methods.[36] [37]
Ecological studies
Supplementary occurrence sources
Bulgaria: Assyov (2023) described a locality in Borovets in the Rila Mountains: 8 October 2016 and 13 November 2020, specimens SOMF29917 and SOMF30896. They grew under Salix caprea and Betula pendula in a young mixed coniferous forest; the presence of birch in the habitat is not evidence of mycorrhiza with birch. Two collection months do not establish the country's full season. The author considered the historical Bulgarian record of the name T. ramentaceum from 1955 to be uncertain, with no specimen found.
Slovakia: Spravodajca Slovenskej mykologickej spoločnosti 12 (1996), p. 28, lists a collection by S. Glejdura under willows in the Borová hora arboretum in Zvolen, 320 m a.s.l., 11 October 1995. The year is indicated by the summary of the list of finds from 1995. The read entry confirms the October observation, not the entire Slovak season. The name in the source preserved the historical record of authorship.
United Kingdom: The Norfolk Fungus Study Group publishes 20 records from 17 sites in the years 1988–2025. Dated entries fall in October–December; Felthorpe Woods has a collection from 22 December 1988. The registry includes, among others, Whitlingham Marsh, Horsey Warren, Thetford, and Holt. Associations with willow or pine were recorded as observed proximity, without default confirmation of a root partner. The Norfolk data were not generalized to the full season of the entire United Kingdom.
Netherlands: The NDFF atlas defines the species as common based on verified observations from the years 2004–2023. Separately, it cites the vulnerable category from the Red List 2008; frequency and threat category describe different issues. It indicates humus-poor sand and an association with Salix repens. The phenology chart is modeled from observations 2000–2021; unread numerical values were not transcribed from it.
Habitat and occurrence
Confirmed distribution range
All areas confirmed in recorded source data.
| Country | Regions and localities | Fruiting | Sources |
|---|---|---|---|
| Bulgaria | No regions identified in recorded data | X–XI — minimum observation scope |
|
| China | Sichuan; Yunnan (Yunnan) | VIII–X — minimum observation scope |
|
| Czech Republic | Plzeň Region; Ústí nad Labem Region | VII–XI |
|
| Denmark | No regions identified in recorded data | Not determined |
|
| United Kingdom | No regions identified in recorded data | X–XII — minimum observation scope |
|
| India | Ladakh; Drass, Ladakh; Kargil, Ladakh | VIII — minimum observation scope | |
| Netherlands | No regions identified in recorded data | Not determined |
|
| Poland | Łódź Voivodeship; Lesser Poland Voivodeship; Podlaskie Voivodeship; West Pomeranian Voivodeship; Pomeranian Voivodeship; Siemianowice Śląskie; Lubusz Voivodeship | X–XII — minimum observation scope |
|
| Slovakia | No regions identified in recorded data | X — minimum observation scope |
|
Sources
- Dz.U. 2014/1408
- Dz.U. 2026/258
- ČMS — odczytano opis gatunkowy, występowanie, oceny i listę obserwacji; nie przeczytano całej cytowanej bibliografii.
- Źródłowo nazwane zakresy badania sprzążek
- ŚredniQ i odchylenie standardowe próby
- Cui i in. 2026 — odczytane metody oraz sekcja74, nie cały artykuł; materiałChiny.
- bulgaria — odczytany zakres dotyczący Tricholoma cingulatum
- ndff — odczytany zakres dotyczący Tricholoma cingulatum
- norfolk — odczytany zakres dotyczący Tricholoma cingulatum
- slovakia — odczytany zakres dotyczący Tricholoma cingulatum
- GBIF exactaccepted5241744, family8787
- Pełna karta i obserwacje odczytane przez Terra w zalogowanym Chrome; zachowany wyciąg, nie surowy HTML.
- Heilmann-Clausen iin. 2017:metody, Table1i dyskusjaT.cingulatum;niecałyartykuł
- IndexFungorum173032:obecnakombinacja 1892, bazionim 1830
- Mehmood i in. 2022, Kavaka58(1): 29–32 — odczytano czterostronicowy artykuł; cechy kolekcji z Indii pozostają w profiluIN.
- Kujawa iGierczyk 2016:odczytanowpisgatunkudruk49/PDF45
- Leake iin. 2004 — ukierunkowanyodczytMethods, Results, Table5iFig1l;rootpartnerSalixrepens, nieSalixcaprea;wyciągniejestsurowymPDF
- Mayirnao i in. 2025 — wyniki składu i testów z materiału Drass, Kargil
- Dokładne źródłowe wyniki kolumny T. cingulatum — Mayirnao 2025
- Otto 2017, AppendixA3, druk181 — ograniczonywyciągweb;nieosiągniętorawPDF
- Wojewoda 2003:wpisT.cingulatumdruk662/PDF664 orazT.ramentaceumdruk668/PDF670;niecałaksiążka